
International service exports accounted for 21 per cent of total global exports (valued at just over $5 trillion) in 2014, a growth of almost 5 per cent compared with the previous year, while merchandise exports (valued at $19 trillion), increased by only 0.3 per cent in the year, as measured in current prices, UNCTAD's Handbook of Statistics 20151 reveals. Total global exports for 2014 were valued at $24 trillion, up by 1.2 per cent compared with the previous year.
Services exports from both developed and developing economies grew strongly in 2014, at 5.3 per cent and 4.8 per cent respectively. But services exports from the transition economies of South-East Europe and the Commonwealth of Independent States (CIS), as well as Georgia, declined sharply in 2014, falling by almost $10 billion or 7 per cent compared with 2013 (chart 1).
Chart 1: Merchandise and Services Exports – developed, developing and transition economies:
1995–2014 (Billion dollars and current prices)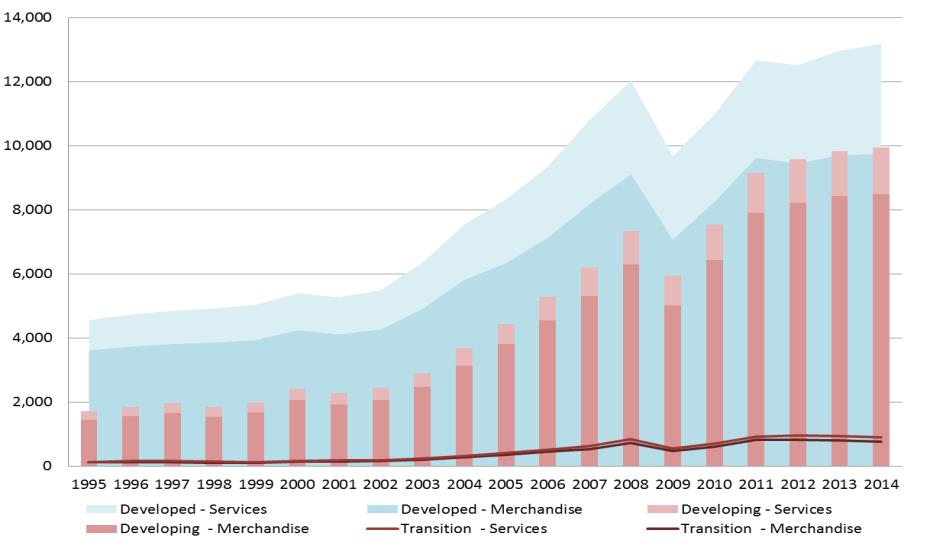
Source: UNCTADstat
While growth in merchandise trade was significantly weaker, a similar pattern was evident – merchandise exports for developed economies grew by 0.4 per cent and by 0.6 per cent for developing economies year-on-year, whereas exports from the transition economies fell by 5.5 per cent or approximately $44 billion.
Total exports from developed economies accounted for 55 per cent ($13.2 trillion) of total global trade. Developing economies accounted for 41 per cent ($10 trillion) of total exports with transition economies accounting for the residual $890 million, or 4 per cent, of exports.
Sectoral patterns were evident in trade exports for 2014. For example, in both developed and developing economies across Africa, Asia and the Americas, exports of food, agricultural raw materials and manufactured goods grew. Growth in exports of food and agricultural raw materials from Africa and Asia, in particular, were strong (4.8 per cent and 3.7 per cent respectively), as was the export of manufactured goods from these regions (2.6 per cent and 4.6 per cent respectively). In contrast, the value of exports of minerals, ores, metals and fuels fell sharply across countries in all regions irrespective of development status. The most significant declines were in the value of fuel exports from Africa (down by 13 per cent) and minerals, ores and metals (including gold) from Asia (down by almost 11 per cent).
The continued fall in commodity prices continued to be significant in 2014 (chart 2). There were notable falls in many commodity prices, including food (down by13 per cent), agricultural raw materials (down by 12 per cent), minerals, ores and metals (down by 18 per cent), crude petroleum (down by 43 per cent ) and gold (down by 6 per cent).
Chart 2: UNCTAD Commodity Prices (Base: Year 2000 = 100): 2005–2015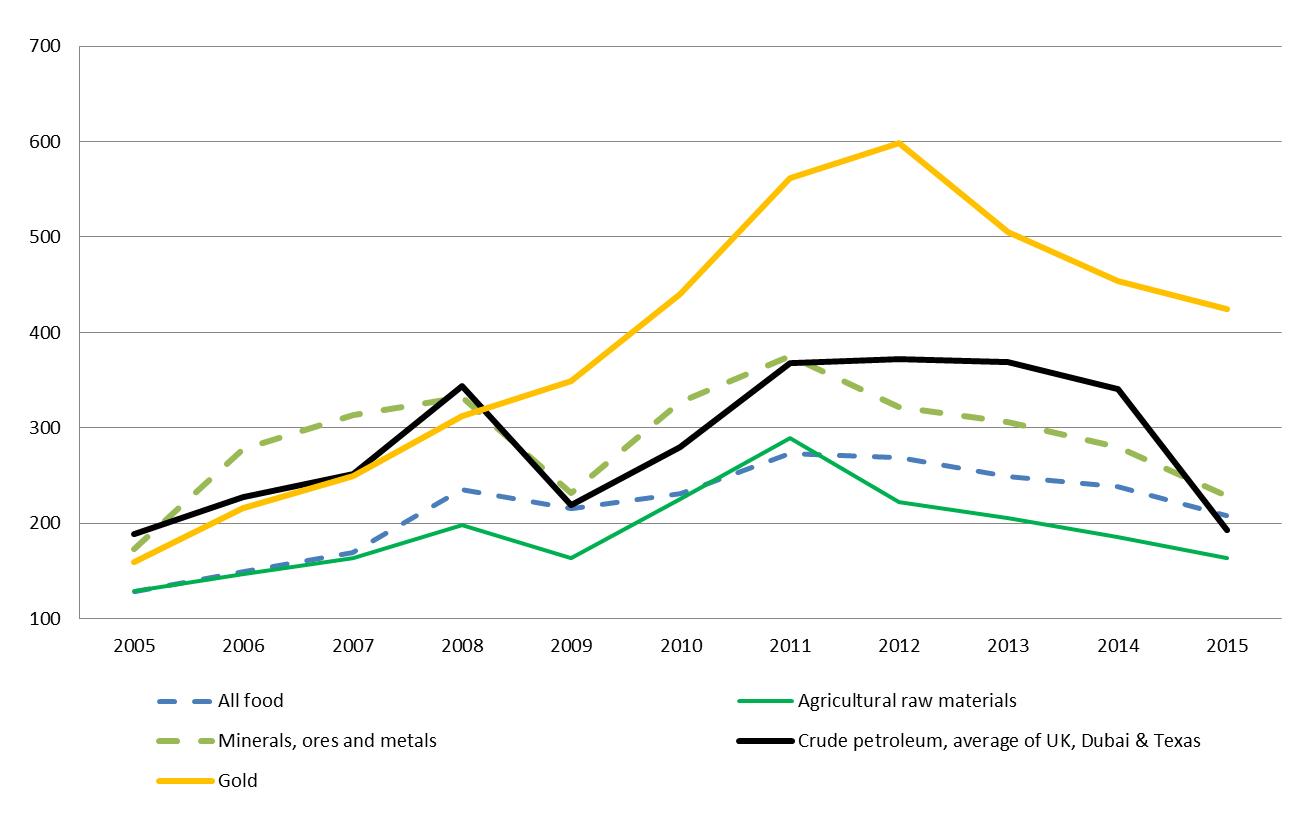
Source: UNCTADstat
The UNCTAD Handbook of Statistics 2015 also shows that total foreign direct investment (FDI) inflows, valued at $1.2 trillion, fell by 16 per cent in 2014 compared with the previous year (chart 3). Declines in FDI flows into transition economies more than halved (down by 52 per cent) but also fell markedly in developed economies (down by 28 per cent). While inward FDI flows to developing economies increased slightly (up by 1.6 per cent), this increase was driven by increases in FDI to developing economies in Asia (up by 9 per cent) which was however offset by declines in FDI to developing American economies (down by 14.4 per cent). There was no change in FDI to developing African economies.
Chart 3: Inward Foreign Direct Investment (flows) – developed, developing and transition economies: 1995–2014 (Billion dollars and current prices)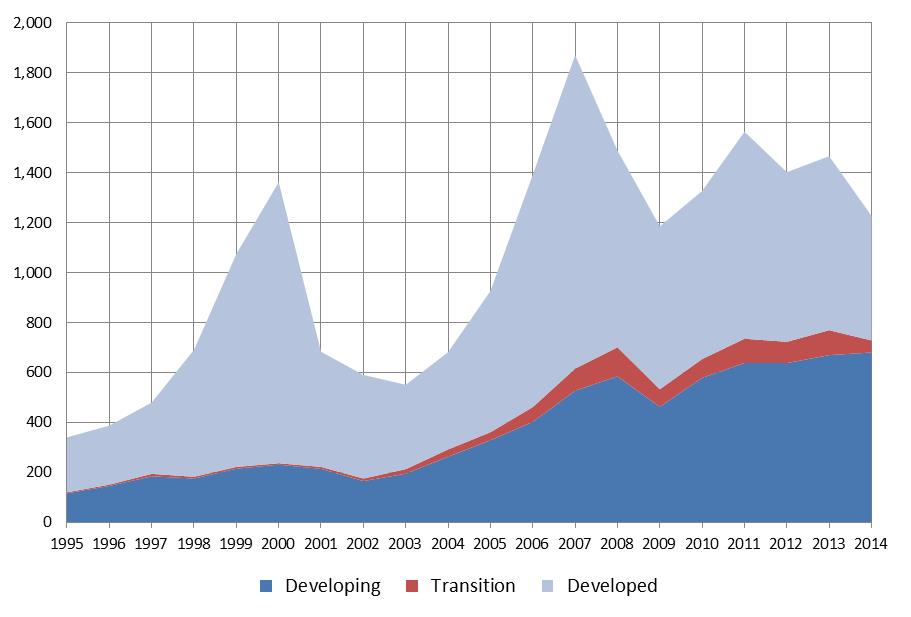
Source: UNCTADstat
Along with detailed statistical tables on international merchandise and services trade, commodity prices and foreign direct investment, the 2015 handbook also provides maritime transport data, other economic and social data, and a range of trade related indicators for all individual economies for which data are available. In addition, the handbook includes figures for geographical regions, various economic groupings and world totals. Each year, the handbook aims to provide data for the analysis and evaluation of world trade, investment, international financial flows and development. To the extent possible, UNCTAD fills in data gaps with estimates in order to furnish the most complete data sets.
UNCTADstat, a rich online database detailing key economic statistics by region and country, including indicators on international trade, economic trends, foreign direct investment, external financial resources, population and labour force, information economy and maritime transport is also available. UNCTAD publishes country profiles which provide a summary overview of the data described above for each county.
Press Release
For use of information media - Not an official record
UNCTAD/PRESS/PR/2015/045 International trade in services was main driver of growth in global trade in 2014
UNCTAD's Handbook of Statistics 2015 reveals that global trade in services grew by 5 per cent as merchandise trade stagnates and foreign direct investment falls
Geneva, Switzerland, 8 December 2015