Written by Thanos Pallis, Theo Notteboom and Jean-Paul Rodrigue, Article No. 117 [UNCTAD Transport and Trade Facilitation Newsletter N°101 - First Quarter 2024]
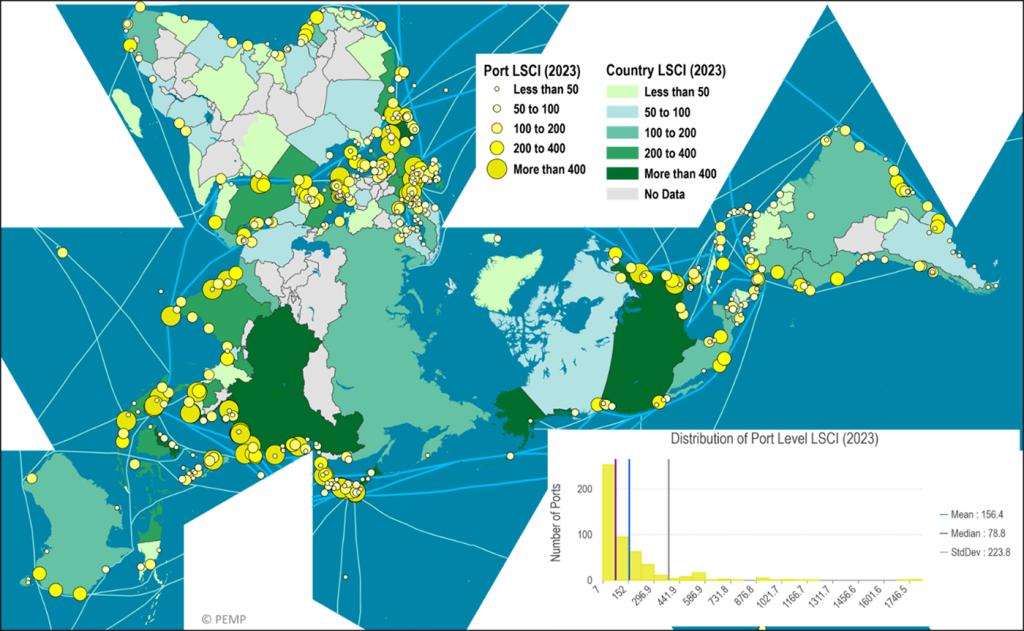
Measuring trends in maritime markets is a dynamic process, as markets change over time. Regarding liner shipping trends, UNCTAD revised its well-established Liner Shipping Connectivity Index (LSCI) in mid-March 2024, adjusting the impact of vessel size on the final index measurements.[1] In the initial index, the country or port that received the highest score in the reference year of 2006 was assigned a value of 100, which serves as a benchmark to assign value to other ports and countries. In 2024, the LSCI was updated so that 100 refers to the average score of all ports. Herewith, we provide a first overview of the revised LSCI and a regional analysis of its trends.[2]
Map: Country and Port Level Liner Shipping Connectivity Index
LSCI evolution for the best-connected countries
The list of the best-connected countries worldwide includes seven Asian countries, the U.S., and two European countries. China (LSCI=1.187,1), South Korea (640,3), and Singapore (591,3) top the list, followed by the U.S. (493,8). The latter is the only country with the best connections that has not experienced improvements in its liner shipping connectivity over the last year. Spain (403,5) is the best-connected European country and stands eighth in the global list.
Compared to a year before (Q1 2023), the percentage increase of the LSCI in South Korea (+6,5%), Japan (+4,8%), and China (+2,7%) exceeded the improvements in the other countries of the list. In four more of the best-connected countries - Malaysia, Spain, Singapore, and Vietnam - the LSCI stands 1% higher. On the other hand, the LSCI stands lower in the Netherlands (-3,3%), the U.S. (-3,3%), and Hong Kong, special administrative regions (SAR) of China (-3,5%). This is reflected in the rise of Japan from the eighth best-connected country in the world to the sixth one, with Hong Kong, SAR of China standing ninth, i.e., three positions lower than a year before.
Compared with five years before (Q1 2019), the LSCI has improved in eight of the best ten. Vietnam has experienced the highest improvement (+30%) and emerged from the 14th best-connected country to the seventh best-connected one. The gap between China (+20,4%) and South Korea (+15%) with Malaysia (+8%), Singapore (3%), the U.S. (+2,5%), and Japan (+2%), increased. Spain (+10%) is the fourth country on the list that has experienced a double-digit LSCI increase. The LSCI stands today lower in two of the best-connected ports of the world: the Netherlands (-8%) and Hong Kong, SAR of China (-13%). The countries on this list five years before were the United Kingdom and Belgium, which have dropped from ninth to 11th and from 10th to 12th, respectively.
(LSCI evolution, Q1 2019 - Q1 2024)
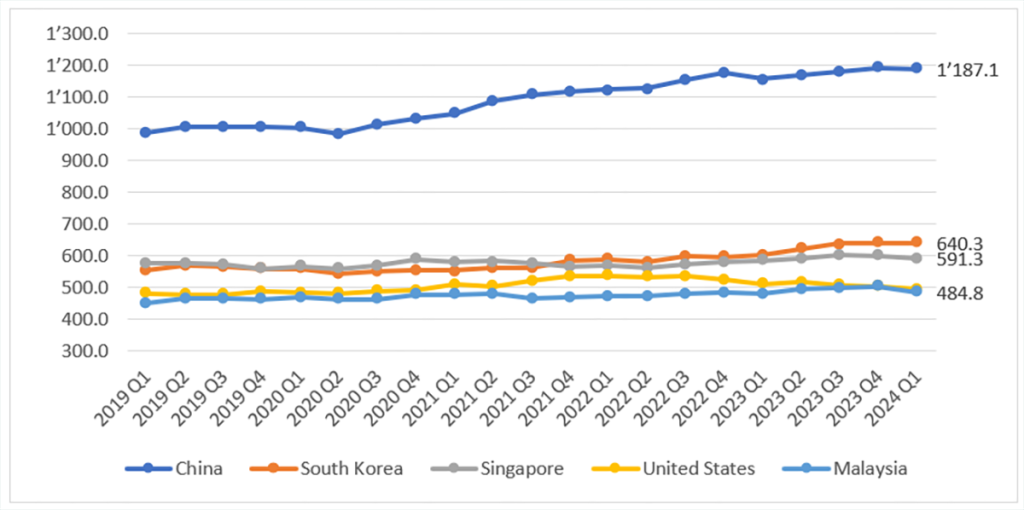
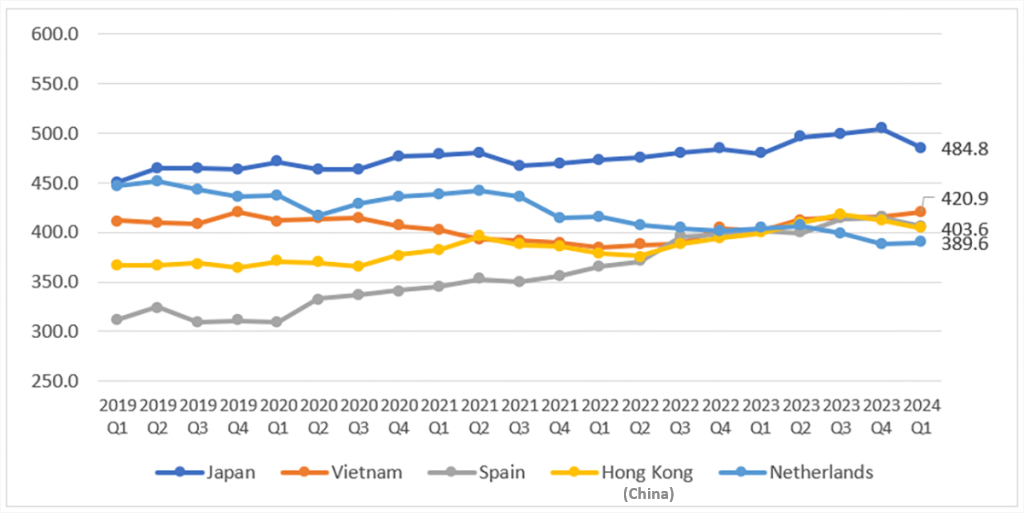
Source: IAPH World Ports Tracker Issue 6; Analysis of data provided by UNCTAD and MDS Trans-modal.
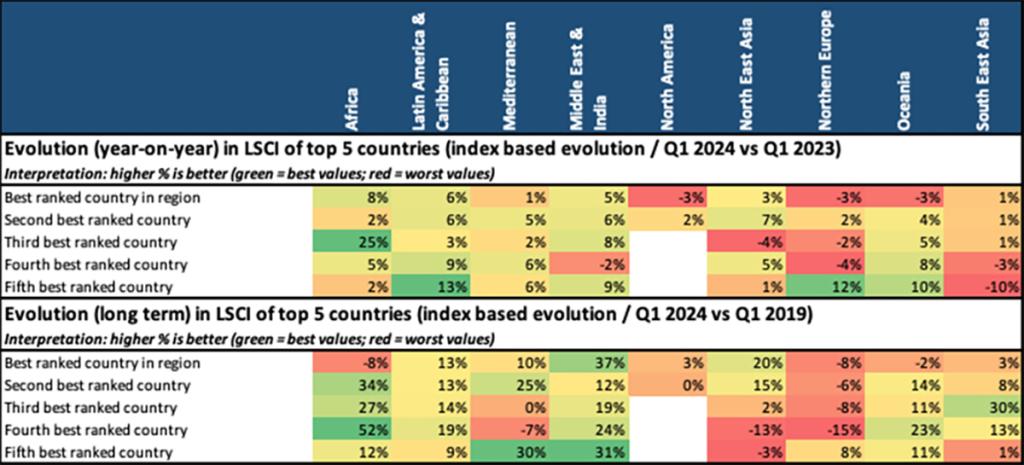
Regional Analysis: main findings
The comparison of LSCI in Q1 2024 with Q1 2023 illustrates a positive connectivity evolution in all five best-connected countries in sub-Saharan Africa, with a major rise in Nigeria (24.6%). A similarly positive shift is recorded in Latin America and the Caribbean (LAC), with Ecuador registering a double-digit LSCI increase and in the Mediterranean Sea. Liner shipping connectivity has also improved in most of the best-connected countries in the Middle East and Indian subcontinent, in Oceania, and to a lesser extent in Northeast Asia. In North America, trends in the US and Canada have gone different ways.
On the other hand, the LSCI of the best-connected countries in Southeast Asia has either improved marginally or, in the cases of Thailand and Indonesia, is lower than a year before. Three of the best-connected countries in North Europe (the Netherlands, Belgium, and Germany) have seen their levels of connectivity decrease.
Compared with five years ago (2019), the scale of increase in four of the five best-connected countries in sub-Saharan Africa has been impressive. In the Middle East and the Indian sub-continent significant improvements also spread in all best-connected countries. LAC and Oceania are the world regions where improvements are of a balanced magnitude. In North America, the LSCI increased by single-digit percentages. The trends have also been positive in Southeast Asia, one of the best-connected regions, yet the growth in some cases (Vietnam and Thailand) has exceeded the regional trends.
The trends in Europe are quite diverse. On the one hand, they have been positive in the Mediterranean Sea, where three of the best-connected countries experienced double-digit percentage LSCI improvements; LSCI growth was marginal in the fourth and negative in the fifth. On the other hand, in North Europe, the four best-connected countries are considerably less connected today than five years ago, and a positive trend occurred in the fifth best-connected one.
Northeast Asia, the region that hosts four of the best-connected countries in the world, is a most illustrative example of the dynamics of liner shipping and ports serving the container market. In the last five years, liner shipping connectivity in the two best-connected countries of the world, China and South Korea, the LSCI increase has been double-digit. In other cases, the trend has been positive to a lesser extent.
Source: IAPH World Ports Tracker Issue 6; Analysis of data provided by UNCTAD and MDS Trans-modal.
Regional Analysis: detailed results
The five best-connected countries in sub-Saharan Africa are South Africa (49th best-connected in the world), Ghana (52nd), Nigeria (which in the last year emerged from the 62nd best-connected country worldwide to 54th), Côte d'Ivoire (55th) and Togo (56th). South Africa recorded a 7.7% increase on a year-on-year basis, Ghana a 1,6%, and Nigeria a 25%. Positive trends occur in Côte d’Ivoire (+5,2%) and Togo (+2,3%). In 22 Sub-Saharan African countries, LSCI was higher in Q1 2024 than in Q1 2023. Liberia, Comoros, Mayotte, Sierra Leone, and Guinea top the percentage growth list, followed by Nigeria and Eritrea. Conversely, the LSCI was lower in 12 Sub-Saharan African countries. Major declines were observed in Djibouti, Gambia, and Namibia.
The five best-connected countries in Latin America and the Caribbean (LAC) are Panama (26th best-connected country in the world), Mexico (28th), Colombia (29th), Brazil (36th) and Peru (37th). In Panama, Mexico, and Colombia, the LSCI stands higher today than the year before by 6%, 6%, and 3%, respectively. As a result, Mexico exchanged positions with Colombia and is the second best-connected country in the region. Brazil continues to emerge; as LSCI increased by 9% yearly, it stands 12 positions higher than in Q1 2023. In Peru, LSCI increased by 13%, enough for the country to return to the list of the best-connected countries in LAC. In 26 countries and territories in LAC the LSCI is higher than in Q1 2023. Due to a 17,3% increase, El Salvador emerged 11 positions in the global rankings. The second biggest increase occurred in Venezuela (+16%), yet the connectivity of the country continues to be 26% lower than five years ago (-15 positions globally). Honduras (13%), Peru (13%) and Ecuador complete the top-five percentage growth list and have gained eight, four, and three positions in the global rankings. On the other hand, the LSCI is lower than in Q1 2023 in 10 LAC countries and territories.
The five best-connected countries in the Mediterranean Sea are Spain (8th best-connected country in the world), Turkey (17th), Italy (18th), France (19th), and Morocco (20th). For Spain and Italy, the LSCI stands higher than a year before by 1% and 1,9%, respectively. In the same period, Turkey (+5,1%), France (+5,6%) and Morocco (+6,1%) experienced a higher percentage LSCI increase. All countries in the region apart from Israel improved their connectivity levels in the last year. Tunisia (+22%; improved its global ranking by 15 positions), Romania (+20%; six positions); Lebanon (+17%; eight positions), Bulgaria (+14%; seven positions) and Algeria (+13%; seven positions) are the five countries that experience a double-digit percentage increase. In Israel, LSCI in Q1 2024 is 29% lower than a year before; no records are available for Ukraine, where activities are minimal.
The best-connected countries in the Middle East and the Indian sub-continent are India (14th best-connected country in the world), the United Arabic Emirates (15th), Sri Lanka (22nd), Saudi Arabia (23rd), and Pakistan (34th). LSCI increased in India (5.1%), UAE (5,7%) and Sri Lanka (7.5%). Saudi Arabia's LSCI declined (-1,7%) and the country dropped two positions in the global rankings. Pakistan (+8.9%) surpassed Oman in terms of connectivity and is now among the five best-connected countries in the region.
Liner shipping connectivity levels are higher than a year ago today in six countries in the Middle East and the Indian subcontinent: Yemen (+47.3%; improved global ranking by 33 positions), Pakistan, Iraq (+17.4%; one position), Sri Lanka, UAE, and India. An LSCI decline occurred in nine countries in the region. Jordan (-26.9%; dropped in the global rankings by 20 positions), Bahrain (-15.3%; -14 positions), Oman (-12.4%; -7 positions), and Syria (-11,1%; -17 positions), are the four countries that experienced a double-digit percentage decline.
In North America, despite a 3.3% LSCI decline on a year-on-year basis, the U.S. remains the fourth best-connected country globally. Since Q1 2019, the U.S. LSCI has improved by 3%. Liner shipping connectivity levels in Canada increased by 1.8% compared to 2023. This was a recovery from recent (minor) negative changes. Canada continues to stand as the 33rd best-connected country in the world.
The five best-connected countries/territories in Northeast Asia include the two best-connected countries in the world, China and South Korea, as well as Japan (6th), Hong Kong, SAR of China (9th) and Taiwan province of China (12th). Since Q1 2023, the LSCI of China increased by 2.7%. In the same period, the increase in South Korea was 6.5% and in Japan was 4.8%. Hong Kong, SAR of China is the only case on the list where the LSCI declined (-3.5%). A significant increase is also recorded in Russia. However, that is essentially a recovery from the highly negative trends produced by the geopolitical events – the LSCI in the case of Russia is today 17% lower than in Q1 2019.
The five best-connected countries in North Europe are the Netherlands (10th best-connected country in the world), United Kingdom (11th), Belgium (88.72; 13th), Germany (16th), and Poland (38th). Overall, on an annual basis, the LSCI levels in the region remained relatively stable. In the Netherlands (-3.3%), Belgium (-2%) and Germany (-3.5%), the LSCI in Q1 2024 stands lower than in Q1 2023. These declines have been consistent in the last five years. Since Q1 2019, the LSCI in the Netherlands and Belgium decreased by 8%. In Germany, the LSCI decline has been even more significant by 15% means that Germany has dropped from the 12th best-connected country in the world to the 16th. In the UK, the LSCI is 1.7% higher than a year before. This reverses the decline since 2019 only partially (it now stands at -6%), and the country has dropped to 11th in the global rankings. Poland experienced a 12,3% LSCI growth in the last year - an 8% growth compared to Q1 2019 – and stands five positions higher in the rankings of the best-connected countries in the world than a year ago. Latvia (+17%; improved its global ranking by seven positions), Iceland (+8%; +5 positions), Lithuania (+8%; +2), and Sweden (+4%; +1) are the other countries in the region where LSCI increased on a year-on-year basis. In the same period, Estonia recorded the most notable LSCI drop (-21%;).
In Oceania and the Pacific, Australia’s LSCI is 3% lower than a year before. Australia is the 35th best-connected country in the world (two positions lower than a year before). Despite a positive LSCI change (3.7%). New Zealand dropped from 48th to 50th best connected globally. Yet, compared with Q1 2019, the LSCI in New Zealand stands 14% higher. Improvements over the last year are recorded in the other three best-connected countries/territories, New Guinea (4.8%; 48th best-connected in the world), New Caledonia (+7.8%) and Fiji (+10%). In all these cases, the LSCI has increased since 2019 by double-digit percentages.
Singapore and Malaysia (the 3rd and 5th best-connected countries in the world), top the list of the best-connected countries in Southeast Asia. They are followed by Vietnam (7th), Thailand (21st), and Indonesia (25th). In Q1 2024, the LSCI of the three first countries stand higher than in Q1 2023 by 1%, and their positioning in the global rankings remains unchanged. Two countries in the region experienced in the last year a decline in the respective LSCI: Thailand (-2.5%) dropped two positions in the global rankings, and in Indonesia (-10.1% dropped five positions). Timor-Leste (14.5%; improved by three positions) and Cambodia (11%; improved by two positions) are the two countries that experienced major LSCI improvements since Q1 2023, followed by Brunei (7.7%) and the Philippines (5.2%).
[1] For details see: Hoffmann J., Rodriguez, L., Salo, B. and Teodoro, A. (2024). New context calls for changing how we measure maritime connectivity. Article No. 114, UNCTAD Transport and Trade Facilitation Newsletter N°101 - First Quarter 2024.
[2] The regional analysis is based on the analysis conducted as a part of: Notteboom T. and Palls T. (2024) IAPH World Ports Tracker, Issue 6, March 2024, Antwerp/Tokyo: IAPH. The full report includes an extended analysis and is available at: https://issuu.com/portsandharbors/docs/iaph_world_ports_tracker_2023?fr=sYmM3NzYyODA0NjE