Foreign direct investment remains stable in least developed countries, but contracts severely in landlocked developing nations and small island developing states.
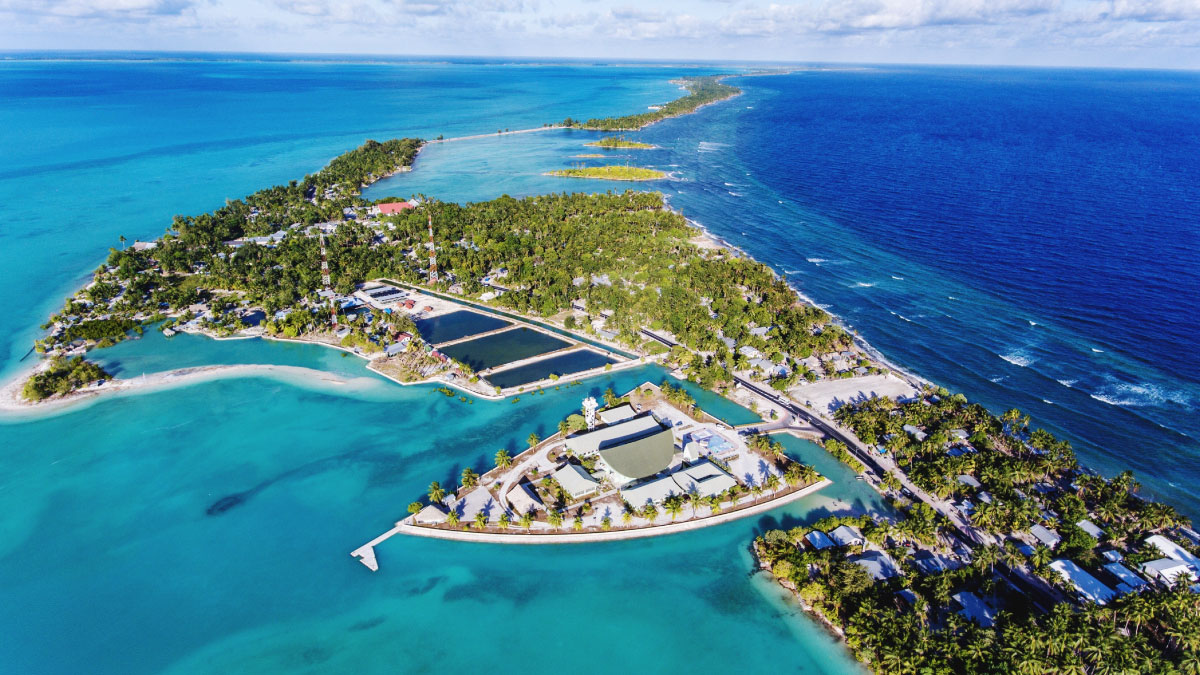
FDI inflows to small island developing states such as Kiribati fell by 40%. © Raimon Kataotao/EyeEm
Under the strains of the coronavirus pandemic, foreign direct investment (FDI) flows to the 83 structurally weak, vulnerable and small economies (SWEs) declined by 15% to $35 billion in 2020, according to UNCTAD’s World Investment Report 2021, published on 21 June.
Inflows to least developed countries (LDCs), landlocked developing countries (LLDCs) and small island developing states (SIDS) combined accounted for only 3.5% of the world total in 2020.
“The coronavirus pandemic has amplified the fragilities of the structurally weak economies. Investment in various sectors relevant for achieving the Sustainable Development Goals, especially in food, agriculture, health and education has been falling” said UNCTAD’s director of investment and enterprise, James Zhan.
“SDG-related investment needs to be scaled up in the post-pandemic period,” he cautioned.
Mr. Zhan highlighted that there is some overlap between the country categories. There are 17 economies that are both LDCs and LLDCs and six that are both LDCs and SIDS.
International push needed
Without a push by the international community, these countries will remain on the margins of the structural changes of the global economy and global FDI.
FDI in the least developed countries (LDCs) remained stable at $24 billion (up by 1.4% from 2019), supported by a 7% hike in Africa. Yet, at the country level, FDI declined in 25 LDCs. In the final year of the Istanbul Programme of Action (implemented from 2011 to 2020), their share in global flows rose from 1.5% to 2.3%, the highest percentage recorded since 2003.
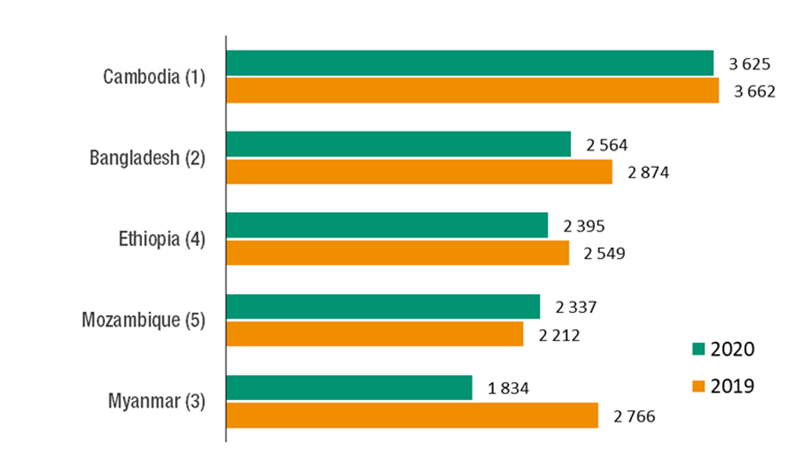
The top five recipients (Cambodia, Bangladesh, Ethiopia, Mozambique and Myanmar, in order) accounted for more than half of total FDI to the group in 2020 (Figure 1). The top 10 (also including the Democratic Republic of the Congo, Lao People’s Democratic Republic, Mauritania, Senegal and Tanzania) accounted for four fifths.
Figure 1 - LDCs: Top 5 recipients of FDI flows, 2019 and 2020
(Billions of dollars)
Source: UNCTAD, World Investment Report 2021.
The number and value of announced greenfield projects, an important indicator of investment intentions, dropped sharply in 2020. The same applies to international project finance deal announcements.
The decline affected investment announcements in sectors relevant to the Sustainable Development Goals (SDGs), which is of concern for plans to help the countries graduate from LDC status. FDI inflows are forecast to remain sluggish in 2021 and 2022.
Major disruptions in landlocked developing countries
The pandemic caused major disruptions in the economic activities of the LLDCs and their FDI inflows contracted by more than 30% to $15 billion, the lowest level since 2007. Though marginal, the share of the group in global FDI flows nevertheless remained stable at 1.5%.
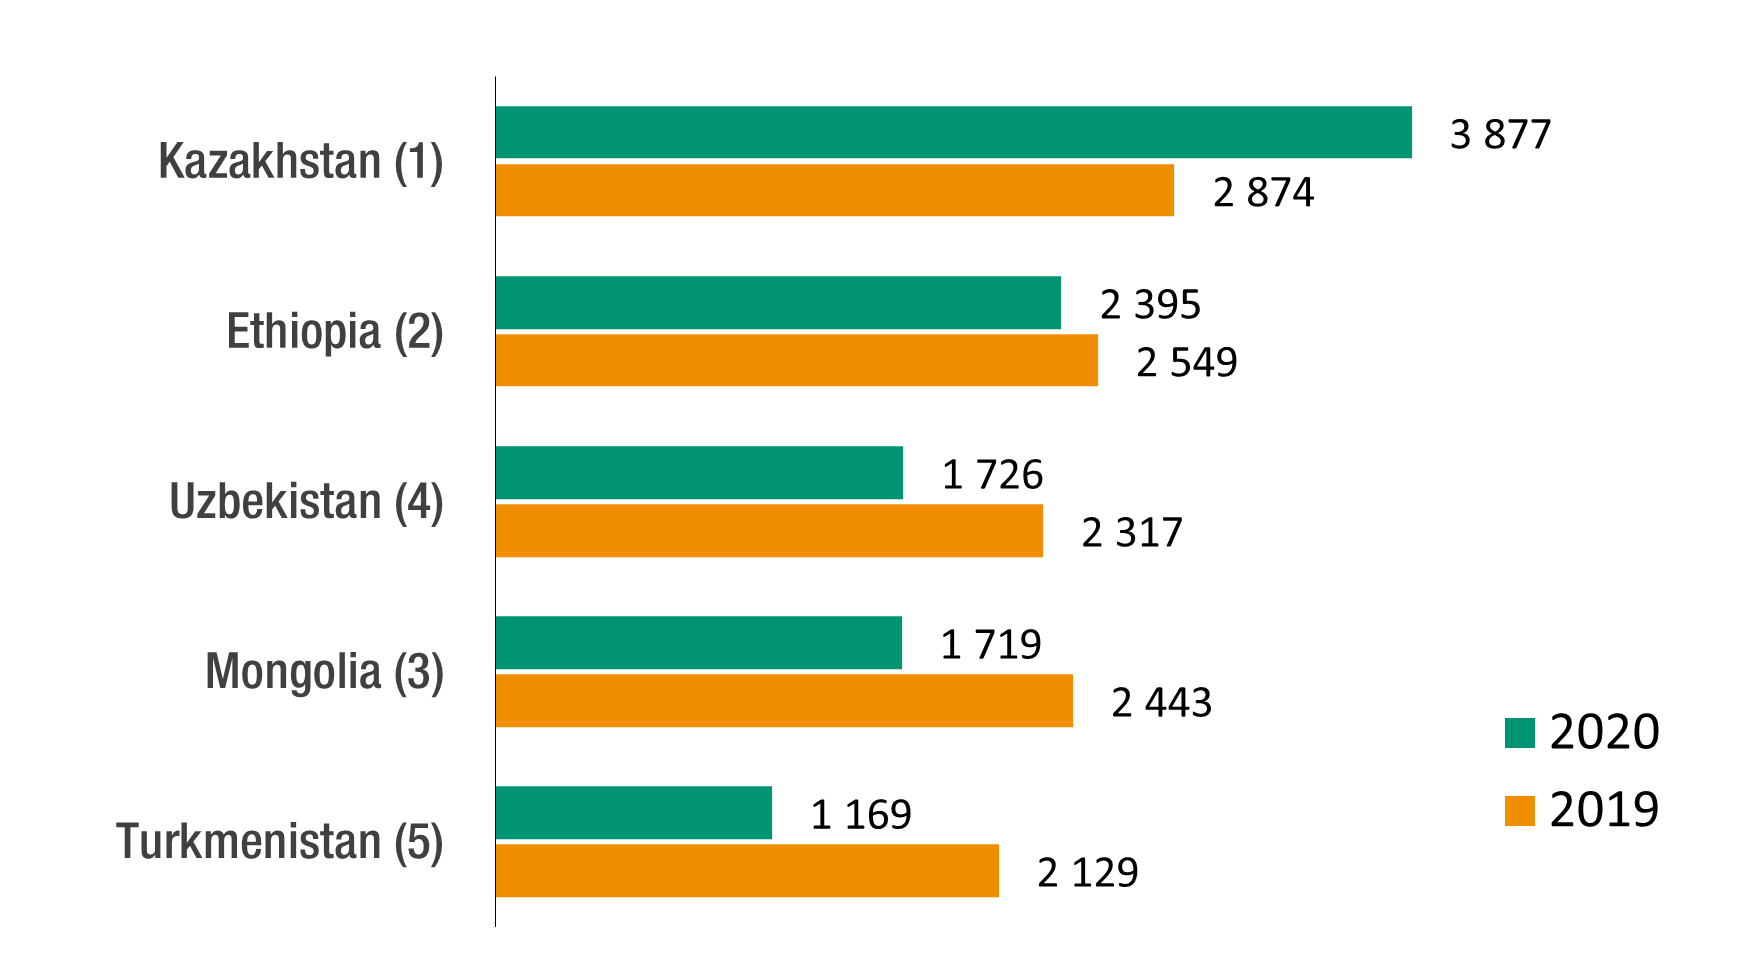
Flows to LLDCs remained concentrated in a few economies, with the top five recipients (Kazakhstan, Ethiopia, Uzbekistan, Mongolia and Turkmenistan, in order) accounting for over 70% of total FDI to the group (Figure 2).
Figure 2 - LLDC: Top 5 recipients of FDI flows, 2019 and 2020
(Billions of dollars)
Source: UNCTAD, World Investment Report 2021.
Government interventions to counter the negative effects of the pandemic are limited by resource constraints in the majority of LLDCs, except for a few countries, such as some Central Asian LLDCs and Botswana, which have accumulated resources in their sovereign wealth funds and other state-owned entities.
In SDG-related sectors, LLDCs attracted a smaller number of international deals than they did in 2019. Nevertheless, international commitments in infrastructure swelled from $2.5 billion to $13.9 billion in 2020. Given their limited access to international transportation and their dependence on neighbouring countries’ infrastructure, LLDCs are expected to attract only low FDI inflows in the coming years.
Steep decline in island nations
FDI inflows to the SIDS fell by 40%, a decline exceeding the world average, to $2.6 billion, a level last seen in 2012. The downturn affected most of the countries and regions of the group. Flows increased in eight countries only.
Reflecting differences in levels of development and factor endowments, a handful of SIDS continued to attract the bulk of inflows. FDI flows to the top five recipients (the Bahamas, Jamaica, Maldives, Barbados and Mauritius, in order) accounted for four fifths of all FDI flows to this group (Figure 3).
Figure 3 - SIDS: Top 5 recipients of FDI flows, 2019 and 2020
(Billions of dollars)
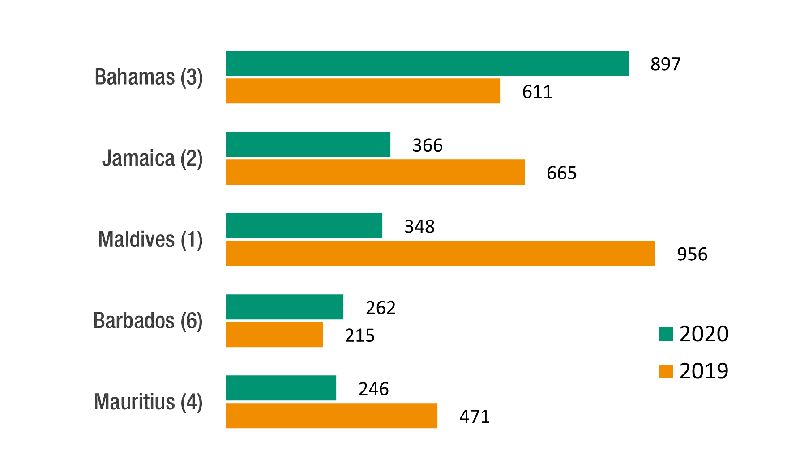
Source: UNCTAD, World Investment Report 2021.
The scale of the contraction, which affected all SIDS regions without exception, highlights the multiple problems that these countries are facing during the COVID-19 pandemic, including the collapse of international tourism, as well as the contraction of demand for mining resources.
Greenfield project announcements dried up in most SIDS, and only three deals were announced in cross-border project finance. All indicators suggest a downward trend in investment commitments in SDG-related sectors.
In 2020, SIDS attracted only 0.4% of FDI flows directed to developing economies (and 0.3% of global flows). FDI flows are expected to remain stagnant in the short to medium term.

