| EMBARGO The contents of this press release and the related Report must not be quoted or summarized in the print, broadcast or electronic media before 17 September 2009,17:00 [GMT] (13:00 New York; 19:00 Geneva, 22:30 New Delhi, 02:00 - 18 September 2009 Tokyo) |
Geneva, 17 September 2009 - The financial crisis and the accelerating economic downturn have adversely affected foreign direct investment (FDI) to and from developed countries as a whole and have modified their role in the global investment landscape, UNCTAD´s annual survey of investment trends reveals.
The World Investment Report 2009: Transnational Corporations, Agricultural Production and Development(1), was released today.
As developed countries were hit first -- and hit hard -- by the 2008 global recession, developing and transition economies´ share of global investment surged. For the year, these flows amounted to 43% of total FDI.
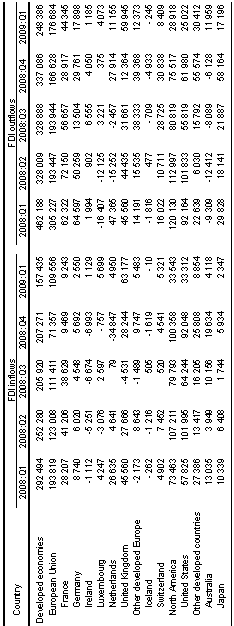
In 2008, inflows to developed countries as a whole declined by 29% to reach US$962 billion, and they slid even more rapidly in the first quarter of 2009. Overall, FDI to the European Union (EU) amounted to US$503 billion in 2008, down 40% from its level in 2007. This was largely due to sharp declines in inflows to the United Kingdom, France, the Netherlands, and Belgium. With the deepening of the financial crisis, FDI activity in the majority of EU countries was down again in the first quarter of 2009 compared to the same period in 2008 (table 1). In Canada, too, a reduction in high-value cross-border investments in the mining and natural resource industries contributed to a significant fall in inward FDI. By contrast, FDI inflows to the United States, mainly from European investors, rose by 17%, to reach an all-time high of $316 billion. Similarly, flows to Japan maintained their upward trend, reaching $24 billion.
The financial crisis and economic downturn also had a dampening effect on cross-border mergers and acquisitions (M&As), the value of which fell considerably in 2008. Transnational corporations (TNCs) from developed countries continued to account for about 84% of total cross-border M&As in developed countries, while TNCs, mainly from China and the Russian Federation, were by far the largest investors from developing countries and transition economies.
FDI outflows from developed countries also were down by 17% over 2007, at $1.5 trillion in 2008. This decline was largely due to a fall in reinvested earnings, as a result of shrinking profits and the repayment of loans by foreign affiliates to the headquarters of TNCs. However, as in the past, developed countries as a group retained their position as the largest net outward investors. Among the biggest FDI source countries, only Japan, Switzerland, Canada, and the Netherlands (in that order) recorded a rise in their FDI outflows in 2008. Although the United States maintained its position as the largest outward investor in 2008, its outflows declined by 18% to $312 billion. Flows from the EU fell by 30%, reaching $837 billion, mainly due to significantly lower FDI from the United Kingdom.
With regard to the sectoral performance of FDI in developed countries, data on cross-border M&As indicated a decline of inflows to manufacturing and services. In the primary sector, on the other hand, inflows rose as a result of a consolidation process in the mining and quarrying industries, and of increasing investments by developing countries.
Overall policy trends during the crisis have so far been mostly favourable to FDI, both nationally and internationally. However, in some countries a more restrictive FDI approach has emerged. There is also growing evidence of "covert" protectionism. Some developed countries have adopted or amended rules concerning the review of foreign investment on national security grounds, while others have adopted measures aimed at further liberalization of their investment regimes, or have changed tax policies and other incentives to promote foreign investment.
The World Investment Report and its database are available online at http://www.unctad.org/wir and http://www.unctad.org/fdistatistics |
ANNEX
Tables and figures
Table 1. Developed countries: FDI flows of selected countries, 2008-2009, by quarter(Millions of dollars)
Source: UNCTAD, World Investment Report 2009: Transnational Corporations, Agricultural Production and Development, table II.27


