Written by Jan Hoffmann and Julian Hoffmann,
Article No. 70 [UNCTAD Transport and Trade Facilitation Newsletter N°89 - First Quarter 2021]
Fifteen years of data show a growing liner shipping network but also a continued trend towards market consolidation
At the end of 2020, there were 944 container ports served by liner shipping services. This reflects an increase of 13% compared to the 834 ports in the first quarter of 2006.[i] The size of container ships calling in most ports has increased during these 15 years, while the number of companies has decreased.
Liner shipping connectivity
To measure a country’s position in the global liner shipping network, in 2004, UNCTAD developed the Liner Shipping Connectivity Index (LSCI). In its current version, the index is jointly produced by UNCTAD and MDS Transmodal, published quarterly for each country and each port on UNCTADstat.
The index is generated from six components, including a) the size of the largest ship, b) the number of companies, c) the number of direct connections, d) the number of services, e) the number of weekly port calls, and f) the total deployed container carrying capacity in TEU.[ii] The trend in the components, as well as the index itself and the number of ports in the network, are depicted in Figure 1.
Figure 1: Trends in container ship deployment, first quarter 2006 to fourth quarter 2020
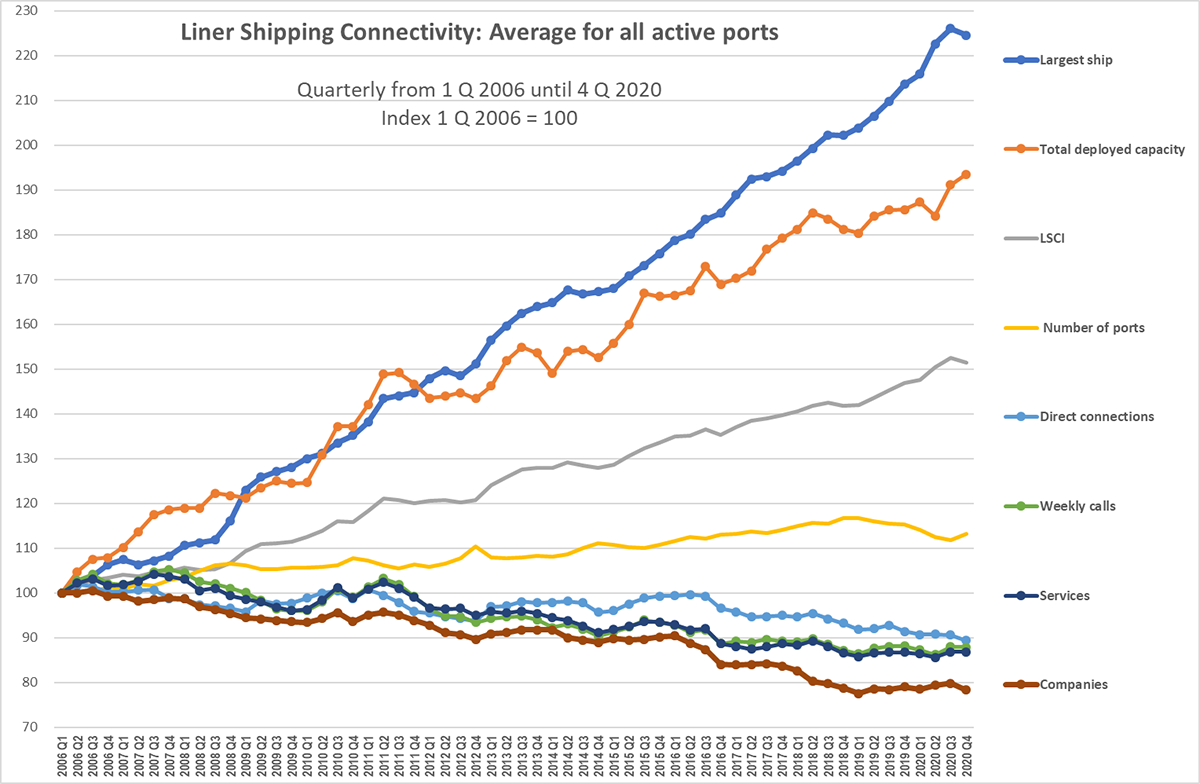
Source: Authors, based on data provided by MDS Transmodal to UNCTAD
Figure 1 shows the average per port at any given trimester. The average size of the largest ships has increased significantly, while the average number of companies has decreased. The deployed container carrying capacity has also gone up, albeit with some volatility, e.g. during the second quarter of 2020, when carriers withdrew capacity in response to the COVID-19 pandemic. The other three components remained – on average – relatively stable with a slight downward trend.
The different components move partly in tandem, notably as regards services, weekly calls and direct connections. Some components, however, can also be considered alternatives, moving at times in opposite directions. In response to growing demand, companies may either deploy bigger ships, or they may deploy more ships, or a combination of both. The total deployed container carrying capacity is the result of the number of port calls multiplied with the average vessel size.
Where companies deploy the biggest ships
For each port, we know the number of companies that provide scheduled services in each quarter, as well as the size (TEU) of the largest ship that is deployed on those services. During the 15 years covered by our data, in the majority of ports, the size of the largest ship has gone up (Figure 2 and Figure 3), while the number of companies providing services has gone down (Figure 4 and Figure 5). Both developments reflect a trend towards industry consolidation.
The largest ships (23 964 TEU) are deployed on Asia-Europe services. Along the Asia-Europe route, Egypt and Morocco also receive ships of 23 000 TEU and above. Further South in Africa, Ghana, Mauritius, South Africa and Togo receive ships of 15 000 TEU deployed on the Asia-West Africa route. In North America, the largest ships call in Los Angeles (23 656 TEU). In Latin America, the Pacific coast receives the largest ships (14 300 TEU) on services connecting Asia with Chile, Colombia, Mexico, Panama, and Peru.
As ship sizes have gone up faster than trade volumes and total deployed capacity (see also Figure 1), the number of services needs to go down if ships are to remain fully loaded. The average (per port) of the largest ship increased by 125% (from 1 996 to 4 482 TEU) between the first quarter of 2006 and the fourth quarter of 2020, while the average number of companies decreased by 22% (from 7.8 to 6.1 companies) during the same period.[i]
Figure 2: Size (TEU) of the largest container ship deployed
Source: Authors, based on data provided by MDS Transmodal to UNCTAD
Figure 3: Distribution of ports by largest container ship deployed
Source: Authors, based on data provided by MDS Transmodal to UNCTAD
In the first quarter of 2006, the largest ships could carry 9 380 TEU, increasing to 23 963 TEU in the fourth quarter of 2020, a rise of 155%. The port with the largest number of companies (i.e. one group of “clients” of the port) in the first quarter of 2006 was Singapore, with 97 companies. In the fourth quarter of 2020, the port with the largest number of companies was Shanghai with 63 companies, while Singapore had only 54 carrier clients left.
Figure 4: Number of companies providing services
Source: Authors, based on data provided by MDS Transmodal to UNCTAD
Figure 5: Distribution of ports by number of companies
Source: Authors, based on data provided by MDS Transmodal to UNCTAD
Ports are the nodes that bring together the ports’ two clients: the carriers and the shippers. Being able to accommodate ever larger ships is a positive indicator of a port’s infrastructure and efficiency, which in principle should benefit both clients. However, if ship sizes go up without bringing additional cargo, ports may be confronted with a trade-off, where they need to invest in more dredging, bigger cranes and expanded intermodal connections to accommodate higher peak demand, while at the same time being left with a smaller number of bigger carriers. In this scenario, the carriers gain bargaining power vis-à-vis both, the ports and the shippers.
Thus, for many ports, investing in infrastructure so as to accommodate larger ships to benefit one group of clients – the carriers – may come at the price of less choice for the other group of clients, the shippers. On the one hand, larger ships help achieve economies of scale and reduce emissions and costs on the sea-leg, on the other hand, less competition poses the danger that cost savings made by the carriers may not be passed on to their clients, the shippers.
Jan Hoffmann, Trade Logistics Branch, UNCTAD, Geneva (Jan.Hoffmann@UN.org); and Julian Hoffmann, data analyst, London (Julian.Hoffmann.Anton@gmail.com)
[i] The information used in the present analysis is from UNCTAD, based on data provided by MDS Transmodal containership data bank https://www.mdst.co.uk/. As new ports are added to the network, other ports are dropped altogether. The 974 ports that are included in the network end of 2020 include 724 of those ports that were also already included in early 2006, plus 266 newly added ports, while 110 ports that received calls in 2006 are no longer included in the global liner shipping network in the fourth quarter of 2020.
[ii] A TEU is a Twenty-foot Equivalent Unit measurement of the standard container. The methodology and trends in the LSCI are regularly presented and discussed in UNCTAD’s annual Review of Maritime Transport.
[i] Figure 2 and Figure 4 depict the means (averages) of the ports that receive liner shipping services during each period (quarter) depicted in the time lapse. The averages would be lower if we included all the ports that during the 15 years received a liner service at least once, because we would then include many ports with 0 (zero) observations during a given period. The improvement over the years would be bigger, given that the global liner shipping network has expanded its coverage to more ports over the years. If the ports with zero services and ships during a given quarter were included, the average per port of the largest ship would increase by 154% (from 1,290 to 3,277 TEU) between the first quarter of 2006 and the fourth quarter of 2020, while the average number of companies would decrease by 11% (from 5.1 to 4.5 companies) during the same period. See also “Ports in the global liner shipping network: Understanding their position, connectivity, and changes over time”, Article No. 57, UNCTAD Transport and Trade Facilitation Newsletter N°87 - Third Quarter 2020.