| PRESS RELEASE The contents of this press release and the related Report must not be quoted or summarized in the print, broadcast or electronic media before 24 September 2008 17:00 GMT (1 PM New York, 19:00 Geneva, 22:30 Delhi, 02:00 - 25 September Tokyo) |
Geneva, 24 September 2008 - Global foreign direct investment (FDI) inflows rose in 2007 by 30% to reach an all-time high of US$ 1,833 billion, according to the World Investment Report 2008: Transnational Corporations and the Infrastructure Challenge(1) , UNCTAD´s yearly review of investment trends. The report was released today. The 2007 flows surpassed the previous record set in 2000 by some US$ 400 billion (figure 1), despite the global financial and credit crises which began in the second half of 2007.
However, the worldwide slowdown appears to augur lower FDI activity for 2008, the report says.
The upward trend in 2007 was apparent in nearly all regions and subregions of the world, and in all three economic groupings: developed countries, developing countries, and the transition economies of South-East Europe and the Commonwealth of Independent States (CIS) (table 1). (For regional trends in FDI, see UNCTAD/PRESS/PR/2008/031 to 035).
The stock of FDI worldwide reached US$ 15 trillion, according to the report. This represents the significant scale of the activities of some 79,000 transnational corporations (TNCs) worldwide which own about 790,000 foreign affiliates. The sales, value added, and exports of these affiliates are estimated to have increased by 21%, 19%, and 15%, respectively, in 2007 (table 2).
FDI inflows to developed countries amounted to US$ 1,248 billion. The United States remained the largest recipient country, followed by the United Kingdom, France, Canada, and the Netherlands (figure 2). FDI inflows to developing countries reached their highest level ever (US$ 500 billion) - a 21% increase over 2006. While South Asia, East Asia, South-East Asia, and Oceania accounted for half of all FDI into developing countries, Latin America and the Caribbean recorded the largest increase (36%). Inflows to West Asia have been growing in recent years and have exceeded those to Africa since 2004. All the same, investment in Africa also reached a historic high. In addition, the least developed countries (LDCs) attracted US$ 13 billion worth of FDI in 2007 - also a record.
FDI outflows from developed countries grew even faster than their inflows, exceeding them by US$ 445 billion in 2007. The United States maintained its position as the largest single source country of FDI (figure 2). Developing countries also continued to gain in importance as sources of FDI, with outflows peaking at US$ 253 billion, mainly as a result of the outward expansion of Asian TNCs. Among developing and transition economies, the three largest sources of FDI were China, Hong Kong (China), and the Russian Federation (figure 2).
Unprecedented levels of cross-border mergers and acquisitions (M&As), reflecting a continuing trend in consolidation of companies, contributed substantially to the global surge in FDI. In 2007, the value of such transactions amounted to US$ 1,637 billion - 21% higher than the previous record set in 2000. Cross-border M&As involving private equity funds almost doubled, to US$ 461 billion - another record - accounting for over one quarter of the value of such transactions worldwide. A new feature of global FDI is the emergence of sovereign wealth funds (SWFs) as direct investors. While the amounts invested by SWFs in the form of FDI remain relatively small, they have been growing in recent years (for details, see UNCTAD/PRESS/PR/2008/037).
The sub-prime mortgage crisis that began in the United States in 2007 has affected financial markets and created liquidity problems in many countries, leading to higher credit costs. However, the capacity of firms to invest abroad appears to have been less affected in 2007 as a whole. The sharp weakening of the dollar helped to stimulate FDI to the United States. The overall policy trend also remains one of greater openness to FDI. UNCTAD´s annual survey of changes in national laws and regulations that may influence the entry and operations of TNCs suggests that policymakers are continuing to make the investment climates in their countries more attractive to TNCs. In 2007, of the almost 100 policy changes identified by UNCTAD as having potential bearing on FDI, 74 aimed at making host-country environments more favourable to FDI, despite growing concerns and political debate over rising protectionism.
The slowdown and financial turmoil in the world economy have led to liquidity crises in money and debt markets in many developed countries. As a result, M&A activity has begun to slow markedly. In the first half of 2008, the value of M&A transactions was 29% lower than in the second half of 2007. UNCTAD estimates that, overall, FDI flows in 2008 will be about US$ 1,600 billion, representing a 10% decline from 2007. This estimate is based on available data for 75 countries relating to FDI flows for the first quarter of 2008. Meanwhile, FDI flows to developing countries are likely to remain fairly stable. UNCTAD´s World Investment Prospects Survey 2008-2010 indicates a lower level of optimism than was expressed in the previous survey, and more caution in TNCs´ investment expenditure plans than in 2007. (For details, see UNCTAD/PRESS/PR/2008/038).
The World Investment Report and its database are available online at http://www.unctad.org/wir and http://www.unctad.org/fdistatistics |
ANNEX
Tables and Figures
Figure 1. FDI inflows, global and by groups of economies, 1980-2007(Billions of US dollars)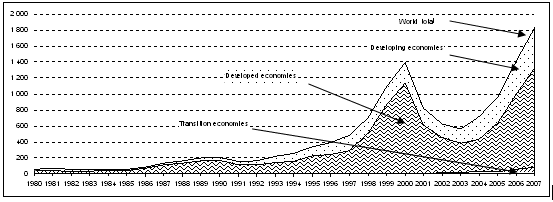
Source: UNCTAD, World Investment Report 2008: Transnational Corporations and the Infrastructure Challenge.
Table 1. FDI flows, by region and selected countries, 2005-2007(Billions of US dollars and per cent)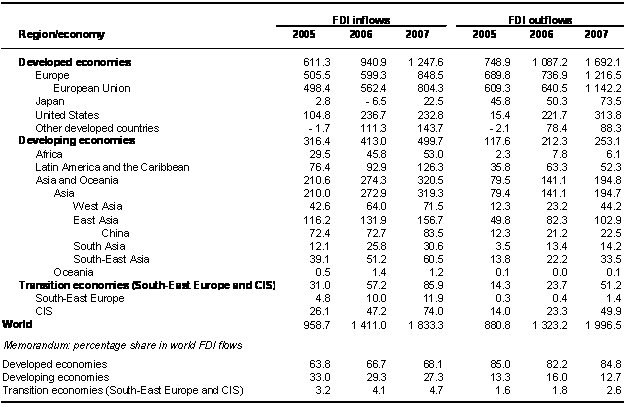
Source: UNCTAD, World Investment Report 2008: Transnational Corporations and the Infrastructure Challenge.
Table 2. Selected indicators of FDI and international production, 1982, 1990, 2006 and 2007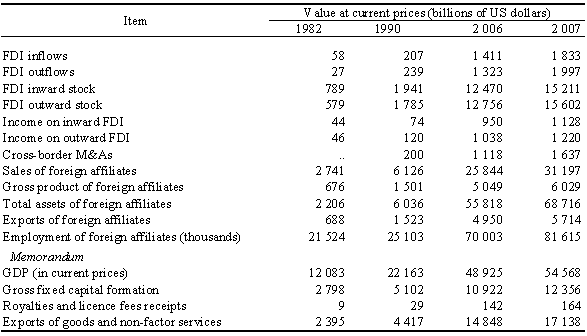
Source: UNCTAD, World Investment Report 2008: Transnational Corporations and the Infrastructure Challenge.
Figure 2. Global FDI flows, top 20 economies, 2006, 2007a(Billions of US dollars)
a - FDI inflows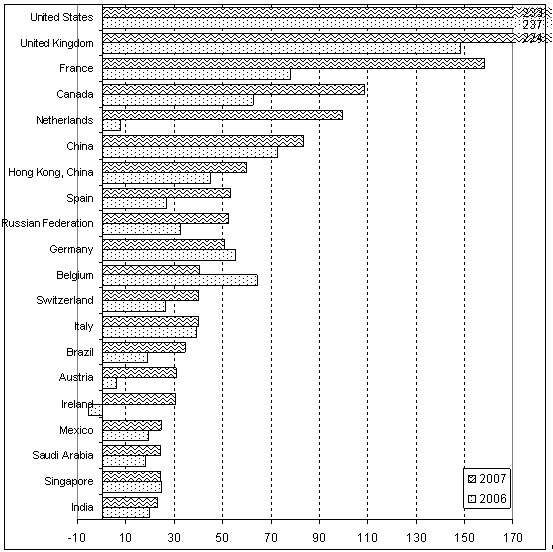
b - FDI outflows 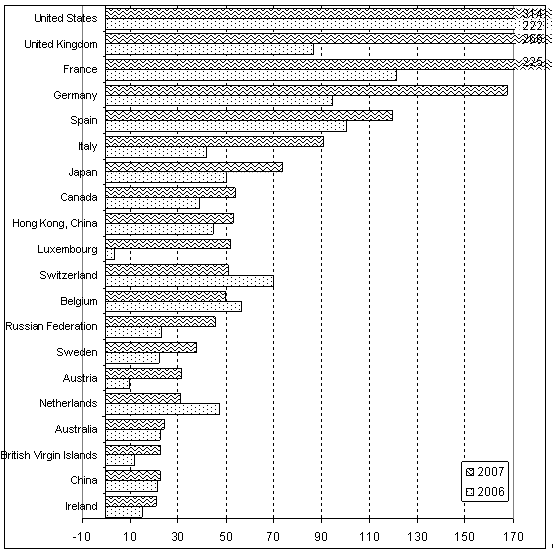
Source: UNCTAD, World Investment Report 2008: Transnational Corporations and the Infrastructure Challenge.
Note:Ranked by magnitude of 2007 FDI flows.


