
Explore global investment data and changing trends
The UNCTAD FDI Explorer shows tracks shifts in global investment flows. Users can explore data by region or economy and compare trends since 1990.
Global foreign direct investment (FDI) edged up 4% in 2024 to $1.5 trillion. But the headline figure masks sharp underlying weaknesses and was inflated by volatile financial transactions through several European economies with high levels of “conduit flows”.
The UN Trade and Development (UNCTAD) FDI Explorer provides a clearer picture of shifts in global investment flows. The interactive tool tracks where FDI comes from and where it goes, where it is rising and where it is falling. Users can select a region or economy, compare trends over time and benchmark against others, with data available back to 1990.
The explorer shows foreign direct investment (FDI) as reported in countries’ balance of payments (BoP) statistics. Its findings may therefore differ from those of the World Investment Report, which adjusts for offshore financial centres, one-off transactions and financial flows to provide a more nuanced view of global trends. For example, the report highlights that global FDI fell by 11% in 2024 when “conduit flows” through several European economies are excluded.
Global investment trends will be in focus at the 16th session of the United Nations Conference on Trade and Development (UNCTAD16), where decision-makers will discuss strategies to realign investment with sustainable development objectives.
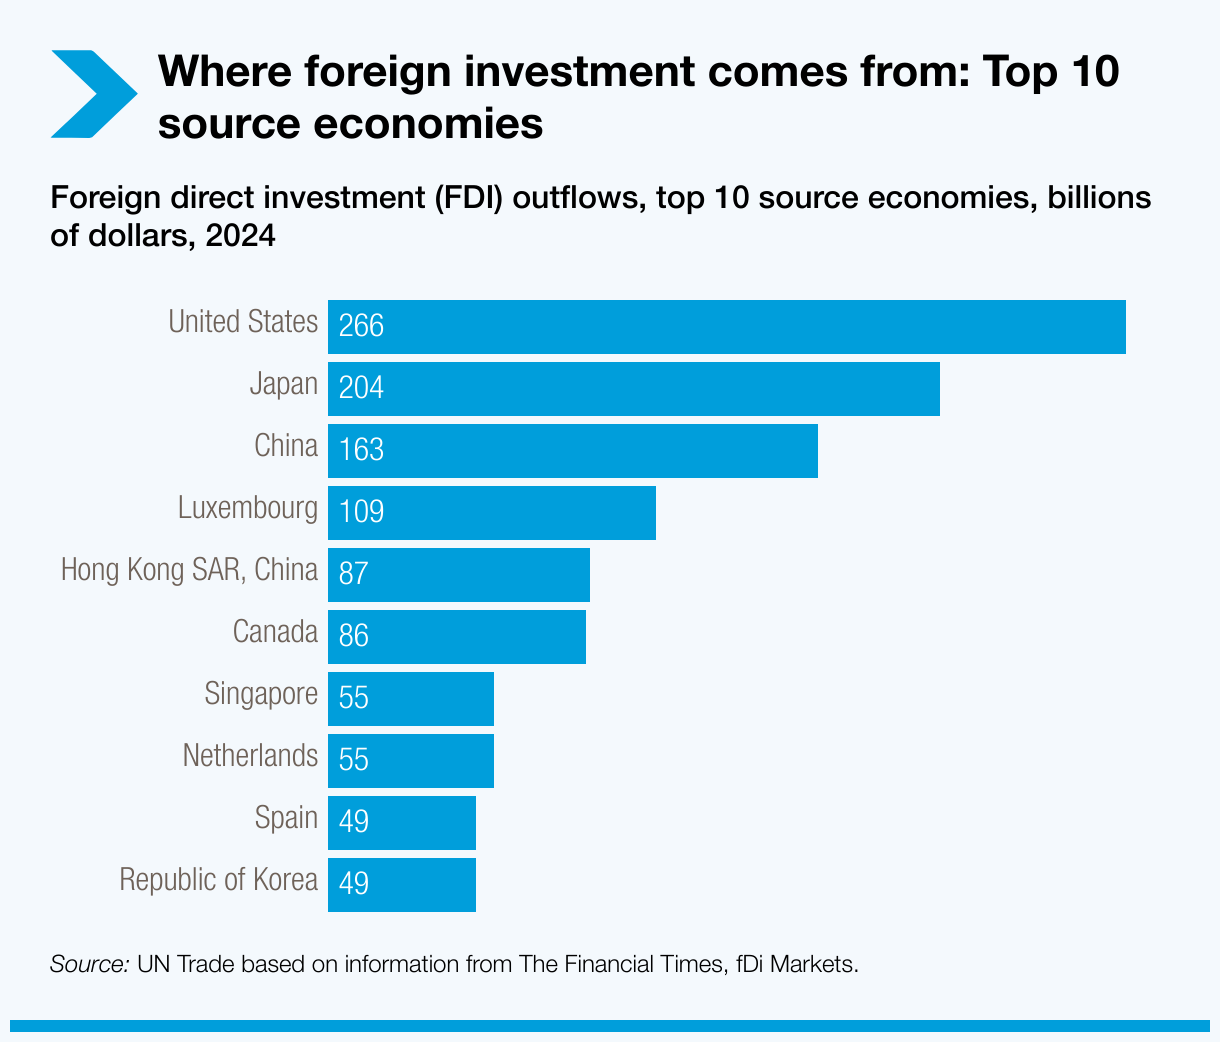
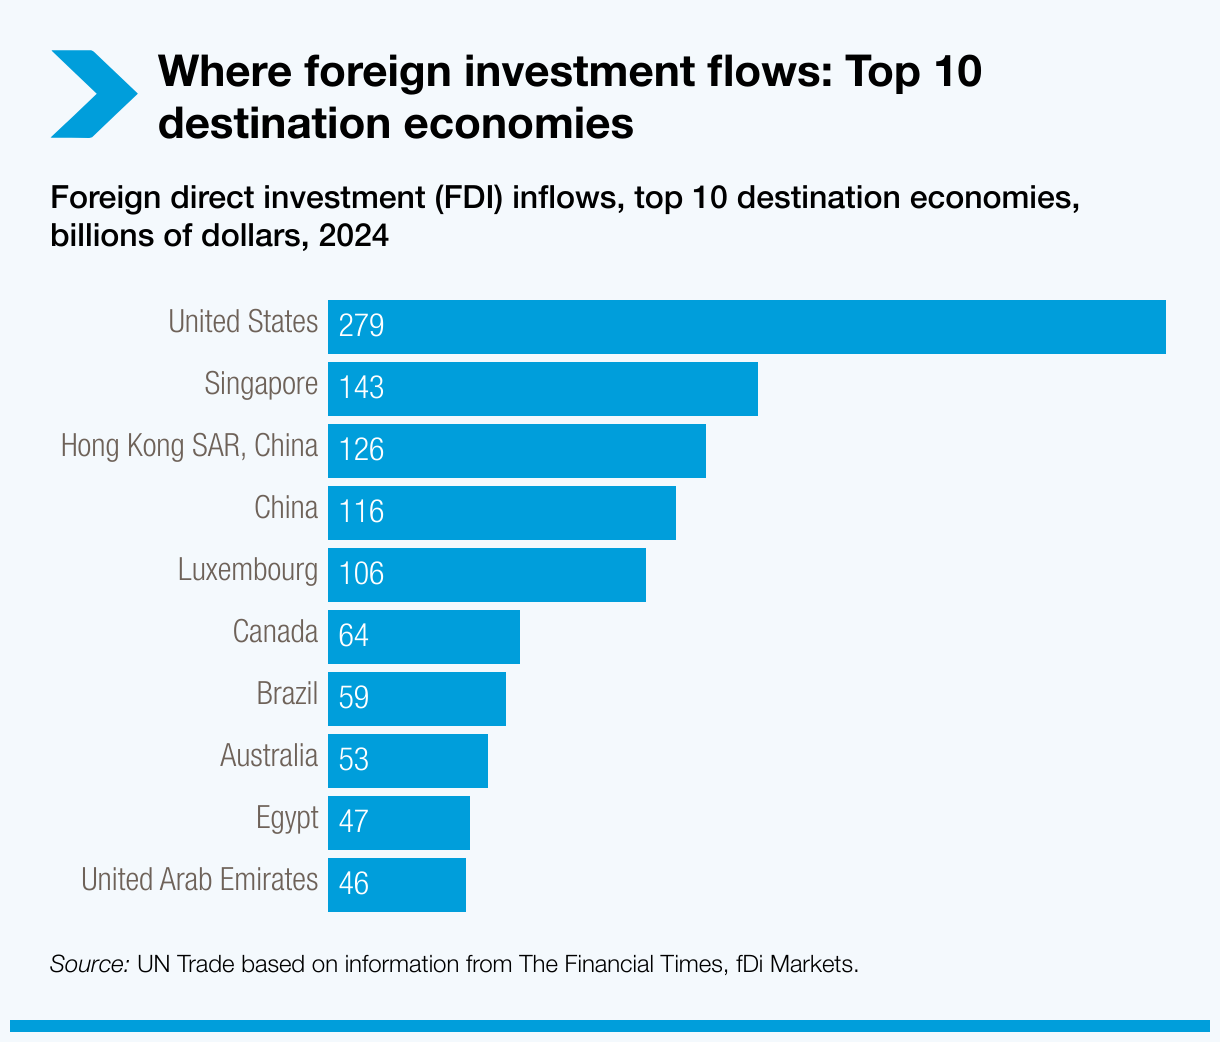
Top FDI destinations and sources
In 2024, the United States remained both the largest source and destination of FDI, underscoring its central role in the global economy. Asia is emerging as a key driver, with five Asian economies among the world’s top 10 sources of outward investment – highlighting the region’s growing weight in global capital flows.
Regional divides are widening
The explorer highlights sharp contrasts in 2024. Developed economies saw FDI fall 22%, with many economies in Europe hit hard: inflows plunged 89% in Germany, while Spain, Italy and France also recorded steep declines.
North America moved in the opposite direction, up 23% on the back of semiconductor megaprojects in the United States.
Africa posted record growth of 75%, driven by a mega project in Egypt. Even excluding it, inflows rose 12%, reflecting reforms and stronger investment facilitation across the continent.
Asia remained the world’s top destination, despite a 29% drop in China. ASEAN countries stood out, with inflows up 10% to a record $225 billion.
In Latin America and the Caribbean, FDI fell 12%, though new projects in Argentina, Brazil and Mexico signalled renewed investor appetite.
The picture is bleak for vulnerable economies. Least developed countries attracted just $37 billion – only 2% of global flows – with capital concentrated in a few nations. Landlocked developing countries saw inflows fall 10%, while small island developing states managed modest 14% growth.
A tool to guide policy and action
The FDI Explorer brings these patterns to life, allowing users to trace flows across economies, sectors and regions.
It provides a clear, data-driven view of where global investment comes from and where it goes. By making investment data easier to visualize and compare, the tool offers policymakers, researchers and investors a valuable resource. For the latest investment policy updates, visit the UNCTAD Investment Policy Hub.