
Region receives 39% of global investment flows – the largest share
Region hosts more than 4,000 special economic zones – three quarters of world total
Foreign direct investment (FDI) inflows to developing countries in Asia rose by 3.9% to US$512 billion in 2018, according to UNCTAD’s World Investment Report 2019.
Growth occurred mainly in China, Hong Kong (China), Singapore, Indonesia and other countries that belong to the Association of Southeast Asian Nations, as well as India and Turkey.
The region remained the world’s largest FDI recipient, absorbing 39% of global inflows in 2018, up from 33% in 2017.
“The prospects for FDI flows to the region in 2019 are moderately optimistic, thanks to a favourable economic outlook and ongoing efforts to improve the investment climate in several major economies,” said James Zhan, director of UNCTAD’s division on investment and enterprise.
East Asia
FDI to East Asia rose by 4% to $280 billion in 2018 with inflows to China – the largest developing economy recipient – increasing by 4% to an all-time high of $139 billion, accounting for more than 10% of the world’s total. Foreign investors established more than 60,000 new companies in the country in 2018.
Flows to Hong Kong (China) rose by 4% to $116 billion, mostly in services sector operations.
FDI to the Republic of Korea dropped by 19% to $14 billion due to a significant decrease in intracompany loans.
South-east Asia
South-east Asia received a record level of investment, up 3% to $149 billion.
Robust investment from Asian economies and strong intra-ASEAN investments supported FDI growth in the subregion.
The growth was driven by strong investment mainly in Singapore, Indonesia, Viet Nam and Thailand.
Manufacturing and services, particularly finance, retail and wholesale trade, including the digital economy, continued to underpin inflows to the subregion.
FDI flows to some countries such as Malaysia and the Philippines declined.
South Asia
FDI inflows to South Asia increased by 3.5% to $54 billion.
Investment in India – the subregion’s largest recipient – rose by 6% to $42 billion with strong inflows in manufacturing, communication, financial services and cross-border merger and acquisition (M&A) activities.
Flows to Bangladesh and Sri Lanka rose to a record level, to $3.6 billion and $1.6 billion, respectively. Pakistan witnessed a 27% decline in investment to $2.4 billion.
West Asia
West Asia, with the largest increases in investment in Turkey and Saudi Arabia, saw a 3% rise in investment to $29 billion, halting an almost continuous 10-year downward trend.
However, inflows were still only one third of the $85 billion peak in 2008 and remained uneven.
Four countries – Turkey, the United Arab Emirates, Saudi Arabia and Lebanon – absorbed approximately 90% of FDI in this subregion.
Decline in outflows
Outflows from Asia declined by 2.5% to $401 billion.
The region remained a significant source of investment, representing 40% of global FDI outflows in 2018.
The decline was mainly due to reduced investment from China, for the second consecutive year, and from Singapore.
Outflows from East Asia dropped to $271 billion and those from south-east Asia ($70 billion) and South Asia ($11 billion) were flat.
Outward FDI from West Asia peaked at $49 billion in 2018, up from $39 billion in 2017 mainly on increased investment from Saudi Arabia, the United Arab Emirates and Turkey.
Outward investment from some economies such as the Republic of Korea and Thailand increased.
Moderately optimistic prospects for 2019
All subregions in developing Asia are expected to receive higher inflows. Prospects are underpinned by a doubling in value of announced greenfield projects in the region, suggesting continued growth potential for FDI.
However, uncertainties stemming from global trade tensions could weigh on the mood.
On outflows, bilateral cooperation under the Belt and Road Initiative is expected to continue to encourage outward FDI along the routes, particularly in infrastructure.
Largest share of world’s special economic zones
Of the 5,400 special economic zones (SEZs) in the world, more than 4,000 are in developing countries in Asia.
China hosts the most, at more than 2,500. South-east Asian countries together host more than 700. South Asia hosts upward of 450 zones and West Asia’s tally surpasses 200.
China’s continued policy experiment in large-area zones, investment facilitation measures and relaxation of foreign ownership in sectors such as finance and health care in pilot free trade zones are expected to draw future investments.
Other countries in the region continue to build more SEZs. South-east Asian countries are planning 200 additional zones.
India, Bangladesh and Pakistan together have more than 200 zones in the pipeline.
As an instrument to support structural transformation, these zones are designed to attract specific industries, such as manufacturing, natural resource processing, or technology-intensive industries and services, to support countries’ structural transformation.
India, the Republic of Korea, the Philippines, and Turkey are focusing on information and technology zones, while West Asia favours services and most of South-east Asia seeks to attract different types of manufacturing.
The development of new SEZs also drives greenfield investment activities, particularly in the construction of industrial establishments and power generation such as the construction of zones in Indonesia, Thailand and Viet Nam.
Figure 1 - Developing Asia: FDI inflows by subregion, 2017 and 2018 (Billions of dollars)
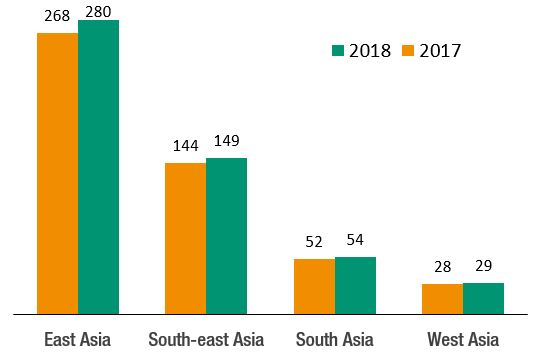
Source: UNCTAD, World Investment Report 2019.
Figure 2 - Developing Asia: FDI outflows by subregion, 2017 and 2018 (Billions of dollars)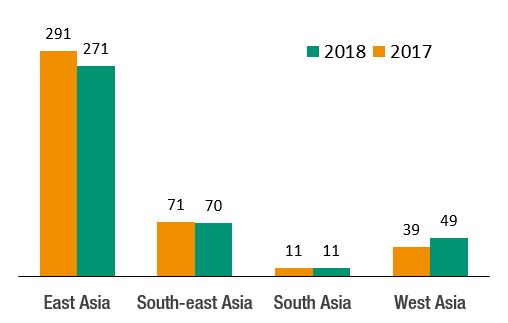
Source: UNCTAD, World Investment Report 2019.
Figure 3 - Developing Asia: economies with the most special economic zones, 2019(Number of zones)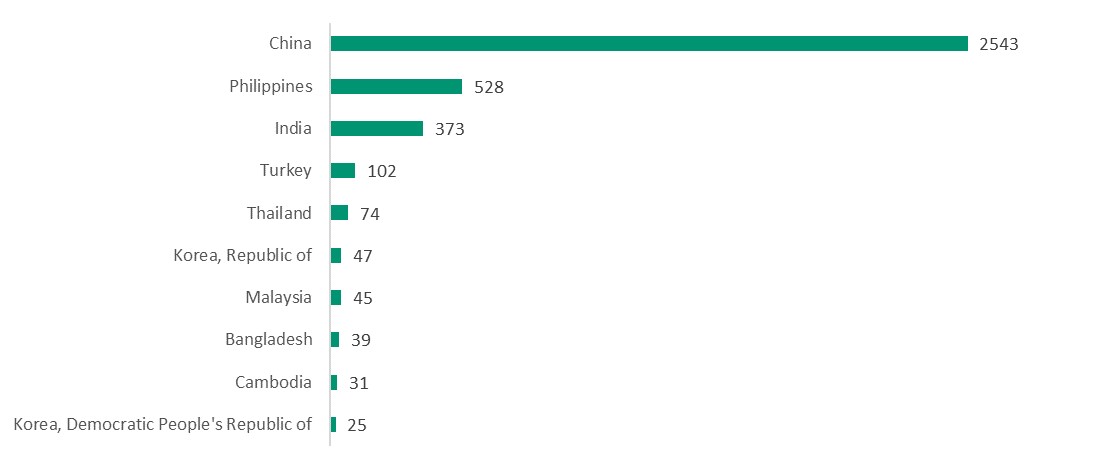
Source: UNCTAD, World Investment Report 2019.