Article No. 41 [UNCTAD Transport and Trade Facilitation Newsletter N°84 - Fourth Quarter 2019]
Bilateral transport costs are a core determinant of bilateral exports. They are too often associated with distance whether absolute or relative. However, as recent research has shown[i] they are also determined by factors that go beyond country geographical characteristics. Maritime connectivity is at the core of trade transport as 90% of the world’s trade is carried by sea. UNCTAD has played a major role in assessing the quality of such connectivity with the elaboration of a Liner Shipping Connectivity Index developed in the mid-2000s which has now become a reference indicator. This analytical effort has been recently complemented by the construction of a bilateral version of the LSCI, the Liner Shipping Bilateral Connectivity Index (LSBCI). This bilateral version brings enough granularity to introduce maritime connectivity into the empirics of international trade.[ii]
A revised version of the LSBCI based on data provided by UNCTAD’s partner MDS Transmodal for the 2006-2019 period has been recently published.[iii] This revision, besides a slight redefinition of the index components, has allowed the inclusion of the year 2007 in the time series and the use of information inter-temporally consistent thanks to systemic recursive quality control. The five components of this revised version are a normalized indicator of:
- Number of transhipments required to get from country A to country B
- Number of direct connections common to both country A and B
- Number of common connections by country pair with one transhipment
- Level of competition on services that connect country A to country B
- Size of the largest ship on the weakest route connecting country A to country B
Connectivity performance
According to the LSBCI calculations reported in Table 1, China-Korea has been the best-connected country pair since 2016. The China-Hong Kong connection liner shipping connection has always been amongst the top five country pair connections, leading from 2006 to 2013 and again in 2015. Until 2010, European country pairs were occupying 4 of the top five positions in the LSBCI ranking and East Asian countries only one. Starting in 2011 the proportions have been inverted. On average bilateral connectivity has not changed since 2006 showing only small fluctuations with a clear drop, however, during the 2008-2010 period. While average values have not changed dramatically except during the 2008-2010 crisis period, median value have shown a decreasing trend reflecting some increasing dispersion amongst connectivity scores: strongly connected country pairs have improved their connectivity scores with respect to poorly connected country pairs. The hub and spoke structure characterizing maritime connectivity has sharpened during the last decade.
Table 1: Top 5 country pairs (selected years)
| CHN | KOR | 2019 | CHN | KOR | 2018 | CHN | KOR | 2017 | CHN | KOR | 2016 | CHN | HKG | 2015 |
| SGP | MYS | 2019 | MYS | SGP | 2018 | MYS | SGP | 2017 | MYS | SGP | 2016 | MYS | SGP | 2015 |
| CHN | HKG | 2019 | CHN | HKG | 2018 | CHN | HKG | 2017 | CHN | HKG | 2016 | CHN | KOR | 2015 |
| CHN | SGP | 2019 | NLD | GBR | 2018 | CHN | SGP | 2017 | NLD | GBR | 2016 | CHN | SGP | 2015 |
| NLD | GBR | 2019 | CHN | SGP | 2018 | BEL | GBR | 2017 | CHN | SGP | 2016 | CHN | MYS | 2015 |
| CHN | HKG | 2013 | CHN | HKG | 2011 | CHN | HKG | 2010 | CHN | HKG | 2007 | CHN | HKG | 2006 |
| MYS | SGP | 2013 | MYS | SGP | 2011 | NLD | GBR | 2010 | BEL | DEU | 2007 | BEL | GBR | 2006 |
| CHN | KOR | 2013 | CHN | KOR | 2011 | NLD | BEL | 2010 | MYS | SGP | 2007 | BEL | DEU | 2006 |
| CHN | SGP | 2013 | NLD | GBR | 2011 | NLD | DEU | 2010 | NLD | DEU | 2007 | MYS | SGP | 2006 |
| NLD | GBR | 2013 | CHN | SGP | 2011 | BEL | GBR | 2010 | BEL | GBR | 2007 | NLD | GBR | 2006 |
Source: UNCTAD_LSBCI based on MSD Transmodal data
Rankings based on averages of bilateral scores obtained by each country, as reported in Table 2, show that China and Hong Kong (Province of China) have been dominating maritime liner connectivity since 2006 with the latter leading during the last three years. Only the United Arab Emirates has been able to take the lead in 2008 and most probably due to non-ordinary circumstances. The appearance of Vietnam amongst the top 5 scorers may signal its dynamism in international trade and the significant structural change under way in the economy. Its connectivity scores improvements were driven mostly by infrastructural developments allowing larger ships to operate in Vietnamese ports. Morocco has also seen its connectivity improve significantly during the last decade. It ranked around the 110th position in 2006 to move up to the 30th in the last five years. The explanation for such a remarkable result is twofold. We observe a significant increase in the number of connections with direct services making the country a sub-regional hub together with a clear improvement in port infrastructure making the docking of larger ships possible. Egypt also appeared amongst the top five and this most probably reflect its strategic geographical position. However, its ins and outs of the top positions may also reflect the dependence of its maritime traffic on Europe’s economic dynamics.
Table 2: Top 5 LSBCI average scores (selected years)
| HKG | 2019 | 0.364 | HKG | 2017 | 0.362 | CHN | 2015 | 0.357 |
| CHN | 2019 | 0.36 | KOR | 2017 | 0.356 | KOR | 2015 | 0.353 |
| SAU | 2019 | 0.359 | CHN | 2017 | 0.355 | SAU | 2015 | 0.353 |
| SGP | 2019 | 0.358 | SGP | 2017 | 0.355 | HKG | 2015 | 0.352 |
| VNM | 2019 | 0.357 | MYS | 2017 | 0.353 | SGP | 2015 | 0.351 |
| CHN | 2012 | 0.347 | CHN | 2009 | 0.335 | EGY | 2006 | 0.335 |
| SAU | 2012 | 0.346 | HKG | 2009 | 0.333 | SAU | 2006 | 0.335 |
| VNM | 2012 | 0.346 | ARE | 2009 | 0.333 | CHN | 2006 | 0.335 |
| EGY | 2012 | 0.346 | SAU | 2009 | 0.332 | TWN | 2006 | 0.334 |
| KOR | 2012 | 0.345 | MYS | 2009 | 0.332 | LKA | 2006 | 0.334 |
Source: UNCTAD_LSBCI based on MSD Transmodal data
Note: Reported scores represent the average of country specific bilateral scores
Driving Forces
All LSBCI components have shown some decreasing trend since 2006 except for the Ship Size one. The average normalized value of the latter has more than doubled in less than 15 years. What the data also suggest is that while the size of ships has increased on average, only few routes have really benefited from this evolution probably because of the huge port infrastructural investments it requires. Direct connections have diminished since 2006 with no sustained recovery from the global crisis period. Moreover, some concentration pattern seems to appear with fewer countries enjoying a direct service to an increasing number of destinations. This is illustrated by Figure 1 which shows that the share of country-pairs connected by some direct services has been fluctuating around 17-18 percent since 2006 with a drop in 2019 to about 16.6 percent. In addition, the share of country pairs connectable with one transshipment has decreased slightly to reach about 63 percent in 2019. As to competition presumably reflected by the number of carriers operating on maritime routes has not evolved on average. While some large differences could be observed until 2010, the global crisis has forced the sector to rationalize and may have affected competition negatively.
Figure 1: Minimum number of transhipments required to connect country pairs: share in total country pairs
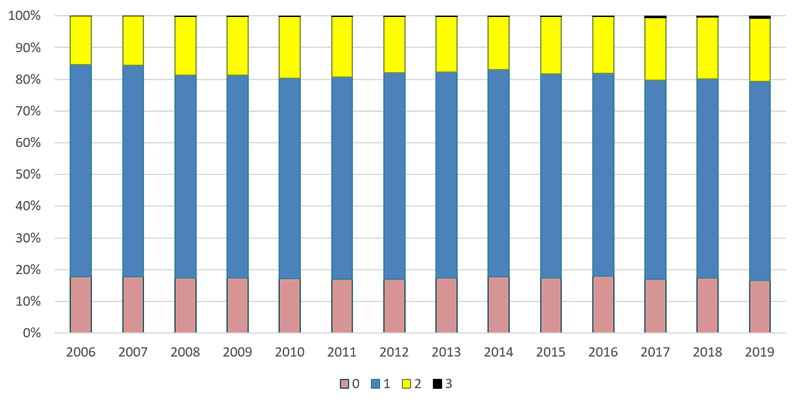
Source: UNCTAD_LSBCI based on MSD Transmodal data
[i]See for instance Arvis, J-F., Duval, Y., Shepherd, B, Utoktham, C., 2013. Trade costs in the developing world: 1995 - 2010 (English). Policy Research working paper; no. WPS 6309. Washington, DC: World Bank.
[ii] See Fugazza, M. and, Hoffmann J. 2017, Liner shipping connectivity as a determinant of trade. Journal of Shipping and Trade, 2, 1-18
[iii] A description of the revised version of the LSBCI and corresponding data for the 2006-2019 period are available at http://stats.unctad.org/lsbci
For further information contact: Marco Fugazza ¦ Economic Affairs Officer ¦ UNCTAD Special Unit on Commodities ¦ Marco.Fugazza@unctad.org