
©potowizard
International trade in goods is expected to continue its nosedive in the coming months as economies struggle to recover from lockdown measures used to slow the COVID-19 outbreak.
New UNCTAD data published on 11 June show that merchandise trade fell by 5% in the first quarter of the year and point to a 27% drop for the second quarter and a 20% annual decline for 2020.
“There is still a lot of uncertainty about the possibility of any economic recovery in the second half of the year,” says Pamela Coke-Hamilton, UNCTAD’s director of international trade.
“International trade is likely to remain below the levels observed in 2019,” she adds, “but how far depends on the pandemic’s evolution and the type and extent of the policies governments adopt as the try to restart their economies.”
The latest UNCTAD figures were featured in the first edition of the Global Trade Update, the organization’s new quarterly report providing a comprehensive snapshot of international commerce and the main issues affecting trade flows.
Trade in goods in 2017-2020
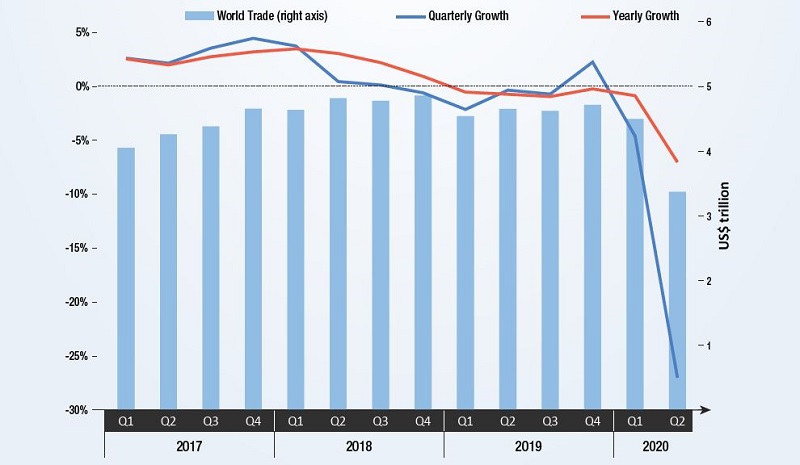
Notes: Quarterly growth is the quarter over quarter growth rate of seasonally adjusted values. Yearly growth is the four-quarter moving average of the quarterly growth rate. Figures for Q2 2020 are estimates.
An increasingly worrying scenario for developing countries
Although the coronavirus-induced trade slowdown has spared no one, forecasts show a particularly rapid deterioration for developing countries. While South-South trade saw a drop of just 2% in the first quarter of the year, UNCTAD data shows a dramatic 14% fall in April.
“For developing countries, while declines in exports are likely driven by reduced demand in destination markets, declines in imports may indicate not only reduced demand but also exchange rate movements, concerns regarding debt and a shortage of foreign currency,” the report says.
Preliminary data for April suggests the sharpest downturn for South Asia and the Middle East, which could register trade declines of up to 40%. Meanwhile, the East Asia and the Pacific regions appear to have fared best, with trade drops remaining in the single digits both in the first quarter of 2020 as well as in April.
China appears to have fared better than other major economies in April, registering 3% growth for exports. But the most recent data indicates that the recovery may be short-lived, as the nation’s imports and exports fell by about 8% in May.
Regional trade in 2020
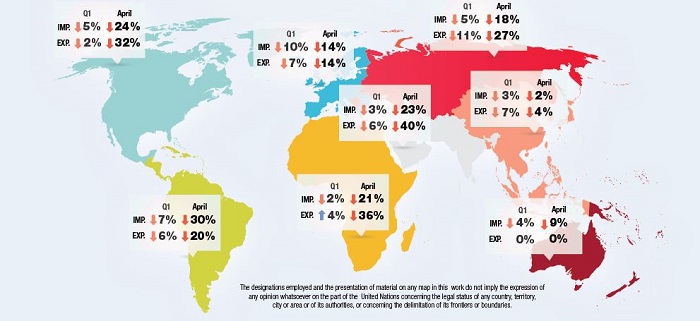
Notes: Statistics for April are preliminary and based on a limited number of countries. Data excludes intra-EU trade.
Automotive and energy sectors collapse, agri-foods stabilize
The report shows that economic disruptions wrought by COVID-19 have affected some sectors significantly more than others.
In the first quarter of 2020, textiles and apparel declined by almost 12%, while office machinery and automotive sectors fell by about 8%. In contrast, the value of international trade in the agri-food sector, which has so far been the least volatile, grew by about 2%.
Preliminary data for April indicates further declines in most sectors, with a very sharp contraction in the trade of energy (-40%) and automotive (-50%) products. Significant decreases are also observed in chemicals, machineries and precision instruments, with drops above 10%.
On the other hand, office machinery appears to have rebounded in April, largely because of China’s positive export performance.
“In general, the variance across sectors,” the report says, “has been driven by decreases in demand and disruptions of supply capacity and global value chains due to COVID-19.”
Sectoral trade in 2020
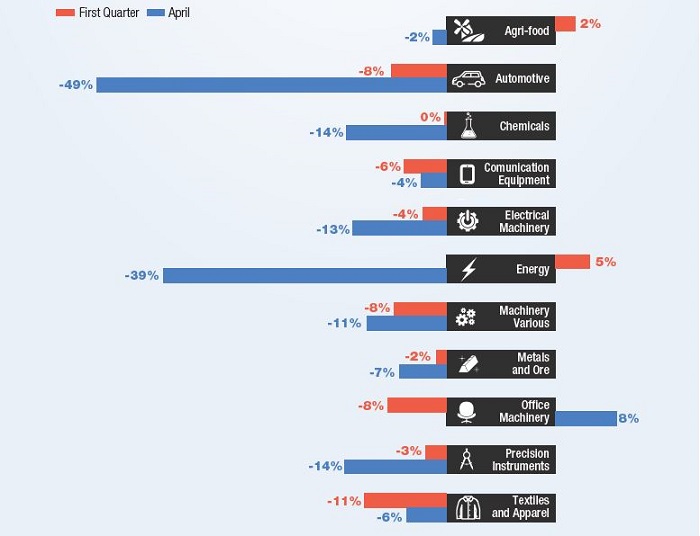
Notes: Percentage changes in world trade are year-over-year. Changes for Q1 are estimated from HS6 digits data of China, European Union and United States, while these for April are estimated only from China and United States data. Data excludes intra-EU trade.
Medical products’ exports more than double
A notable side effect of the COVID-19 pandemic has been the increase in demand for medical goods and equipment, such as ventilators, monitors, thermometers, hand sanitizers, protective masks and garments.
While the international trade of such goods contracted at the onset of the pandemic, it rebounded in February and March and almost doubled in April 2020, as countries scrambled to secure medical and protective equipment.
The flow of imports and exports, the report says, followed the spread of the virus.
For example, the first two months of 2020 saw an increase in Chinese domestic demand, resulting in a jump in medical product imports, primarily from Europe and the United States, which had not yet been significantly hit by the pandemic.
Meanwhile, Chinese exports of such equipment dropped by 15% as national production shifted towards satisfying domestic need.
Data for March shows that at as the pandemic took hold in Europe, imports of medical equipment jumped by 21% in the region while continuing to increase in China (41%).
Then in April, as COVID-19 eased its grip on China and continued its spread across the globe, Chinese exports of medical equipment surged by a staggering 338%, driven primarily by exports of protective equipment.
The month’s data for the United States reflects the spread of COVID-19 within the nation, with medical product imports increasing by almost 60% while exports declined by approximately 20%.
Trade in medical products in 2020
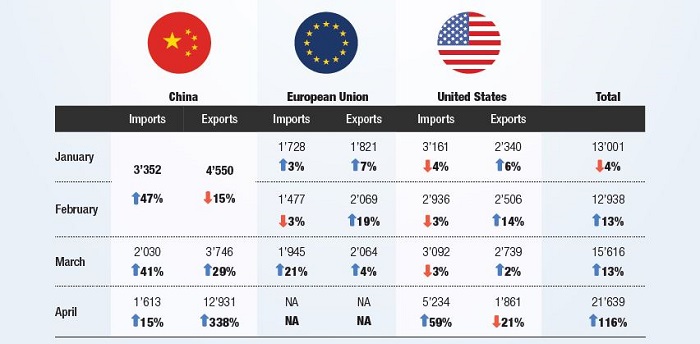
Note: Figures are in US$ million and percentage changes are year-over-year. Data excludes intra-EU trade.