Written by Danijel Bajt and Yann Duval,
Article No. 47 [UNCTAD Transport and Trade Facilitation Newsletter N°85 - First Quarter 2020]
The WTO Trade facilitation agreement (TFA) entered into force in February 2017 with the aim to expedite the movement, release and clearance of goods and to facilitate effective cooperation among Members on trade facilitation and customs compliance issues. It has become the new baseline for trade facilitation efforts everywhere. Building on this foundation, trade digitalization to enable the seamless electronic exchange and legal recognition of trade-related data and documents across borders, rather than only between stakeholders located in the same country, has enormous potential for making trade even more inclusive and supportive of sustainable development. y. Full implementation of cross-border paperless trade will not only reduce transaction time and costs but also increase regulatory compliance and enable the more direct engagement of small and medium-size enterprise (SMEs) in international trade and cross-border e-commerce. Estimates suggest that full implementation of a WTO TFA+ set of measures, including cross-border paperless trade, could reduce trade costs in Asia and the Pacific by an average of 25%.
In this context, ESCAP together with the other four United Nations (UN) Regional Commissions and supported by other partners, including UNCTAD, have regularly conducted a worldwide assessment of the implementation of trade facilitation and paperless trade measures. The latest UN Global Survey on Digital and Sustainable Trade Facilitation was conducted between January and June 2019.[i] The Survey covers 128 economies, and an ambitious set of over 50 trade facilitation measures, including TFA provisions as well as many WTO TFA+ “Digital Trade Facilitation” measures - the implementation of innovative, technology-driven measures aimed at enabling the use and exchange of electronic trade data and documents – and “Sustainable Trade Facilitation” measures – measures targeted at trade facilitation for SMEs, agricultural sector and women.
Based on the UN Survey, this article briefly presents the state of play in implementation of trade facilitation and paperless trade globally, with a focus on the Asia-Pacific region.
Overview of progress in implementation of trade facilitation and paperless trade
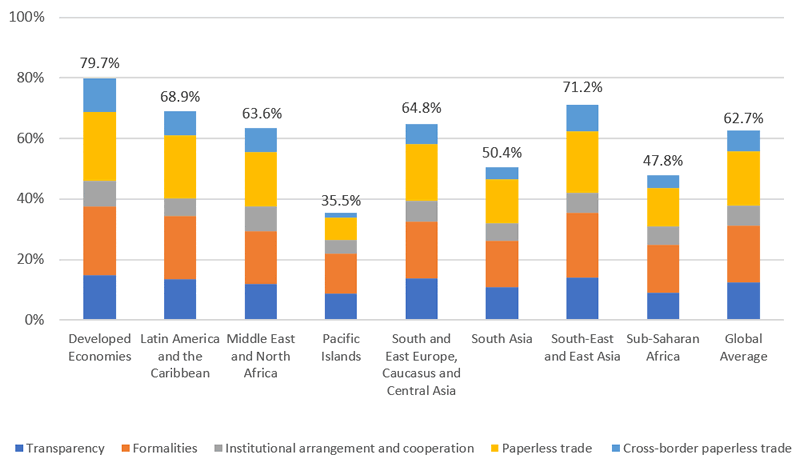
A shown in Figure 1, the global average implementation of an ambitious and forward-looking subset of the WTO TFA+ measures included in the survey stands at 62.7%. Developed economies have the highest implementation rate (79.7%), while the Pacific Islands have the lowest (35.5%). Among the developing regions, South-East and East Asia, and Latin America and the Caribbean achieve high implementation rates at 71.2% and 68.9% respectively. Implementation in Sub-Saharan Africa – which includes some of the poorest countries in the world – is only 47.8%, second only to the Pacific Islands.[ii]
Australia and Republic of Korea (94.6%) tie for first place as the best overall performers, followed by Belgium, the Netherlands, Japan and Singapore, each with an implementation rate of 93.6%. Among developing regions, the Republic of Korea (94.6%) and Singapore (93.6%) lead in South-East and East Asia. Mexico leads the Latin America and the Caribbean, while Morocco leads the Middle East and North Africa region. Azerbaijan, Russian Federation and the Republic of North Macedonia (81.7%) together lead the South and East Europe, Caucasus and Central Asia region, while India (79.6%) leads the way in South Asia. Countries with special needs – LDCs, LLDCs and SIDSs – achieve implementation rates ranging between 43% and 55%, which is significantly below the global average implementation rate.
Progress has been made in essentially all the countries covered by the survey between 2017 and 2019. Implementation at the global level has, on average, increased by 8.1 percentage points over the last two years. The most progress is observed in South and East Europe, Caucasus and Central Asia and Sub-Saharan Africa, where implementation rates have increased by 11.5 percentage points. A substantial improvement was also observed in South Asia (9.7 percentage points), South-East and East Asia (9.3 percentage points), Pacific Islands (8.3 percentage points) and Latin America and the Caribbean (7.8 percentage points). In contrast, progress was less significant in the Middle East and North Africa, and Developed Economies, where increases of only 3.2 and 4.3 percentage points have taken place, respectively.
Figure 1: Implementation of trade facilitation and paperless trade around the world
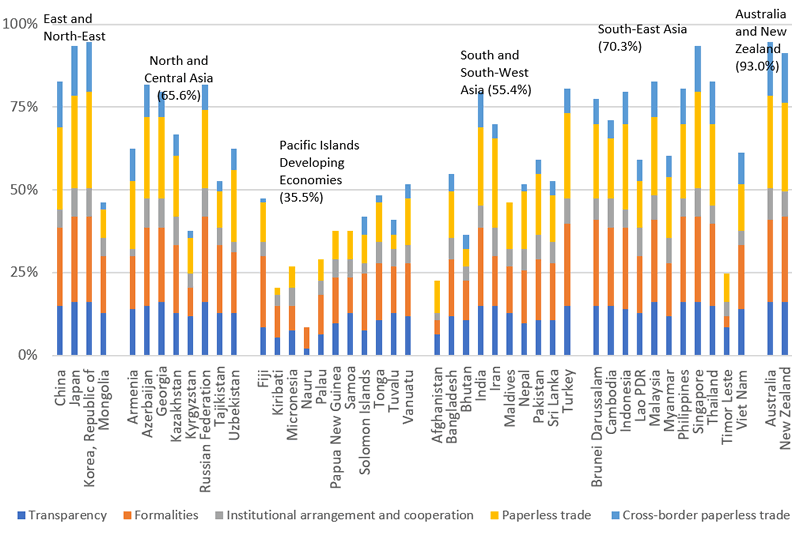
At the regional level in Asia and the Pacific, trade facilitation implementation levels vary greatly across sub-regions and countries (see Figure 2). Aside from Australia and New Zealand, East and North East Asia achieved the highest average level of implementation at 79.3%, followed by South-East Asia, North and Central Asia, and South and South-West Asia. Pacific Island Developing Economies lag far behind other sub-regions. At country level, the Republic of Korea, Japan, Singapore, Australia and New Zealand achieve scores in excess of 90%. The regional implementation rate increased by over 10% since the last survey was conducted in 2017, reaching nearly 60% in 2019. All countries and subregions have made progress. The highest progress is observed in North and Central Asia, followed by South-East Asia, and South and South-West Asia.
Figure 2: Implementation of trade facilitation and paperless trade in Asia-Pacific
Both globally and regionally, trade facilitation implementation levels vary across groups or types of measures. Generally, the level of implementation of WTO TFA-related measures such as transparency measures is relatively high, while measures involving the use of information communication technologies (ICT) or cross-border collaboration have significantly lower rates of implementation.
State of play in paperless trade facilitation
Globally, as a group of measures, implementation of paperless trade measures stands at 61% and it has increased by approximately 8 percentage points between 2017 and 2019. This group of measures relates to the application of modern information and communication technologies (ICT) to trade related services, ranging from the availability of internet connection at border-crossings and the automation of Custom systems to full-fledged electronic single window systems.
The implementation rates vary greatly depending on the individual paperless trade measure considered. As shown in Figure 3, the most implemented measure globally is Automated customs system, with an overall implementation rate exceeding 84% both globally and regionally. Over 70% of the 128 countries in the survey have nation-wide automated customs systems in place. In contrast, Electronic application and issuance of preferential certificate of origin has been fully implemented in less than 20% of the countries. Electronic single window system has been fully or partially implemented in approximately 65% of the countries and in another 10% in on a pilot stage of implementation, showing that countries globally are actively working on the implementation of this measure.
Overall, implementation patterns and levels in Asia-Pacific are very similar to those observed at the global average (58%). The region’s implementation rate of paperless trade measures has increased by 10 percentage points between 2017 and 2019, slightly exceeding the rate of progress at the global level.
Figure 3: Global and Asia-Pacific implementation of paperless trade measures
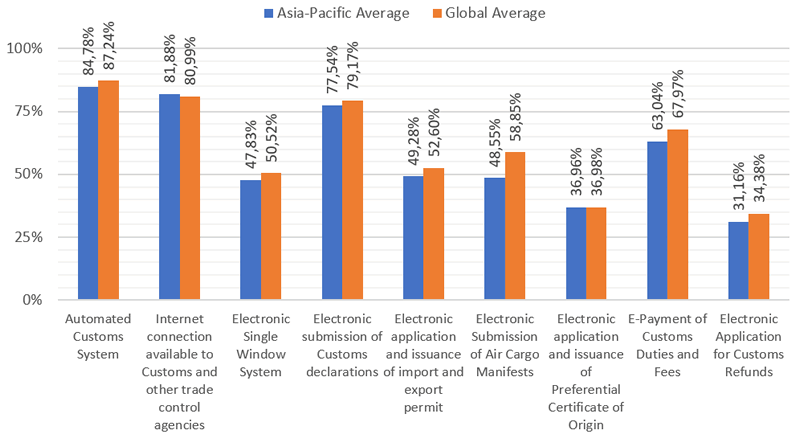
Figure 4 features implementation of digital trade facilitation measures that require cross-border collaboration, i.e., cross-border paperless trade measures. The global average is substantially lower than that of the other groups of measures, standing at 36%. This group of measures includes measures for enabling the exchange and legal recognition of trade-related data and documents between stakeholders located in different countries - along the entire international supply chain. The exchange of trade related documents across borders is essential to achieving a fully integrated paperless system. Implementation of cross-border paperless trade remains low in particular given the difficulties involved in achieving consensus on technical and legal issues associated with exchanging electronic data and documents across borders.
Figure 4: Global and Asia-Pacific implementation of cross-border paperless trade measures
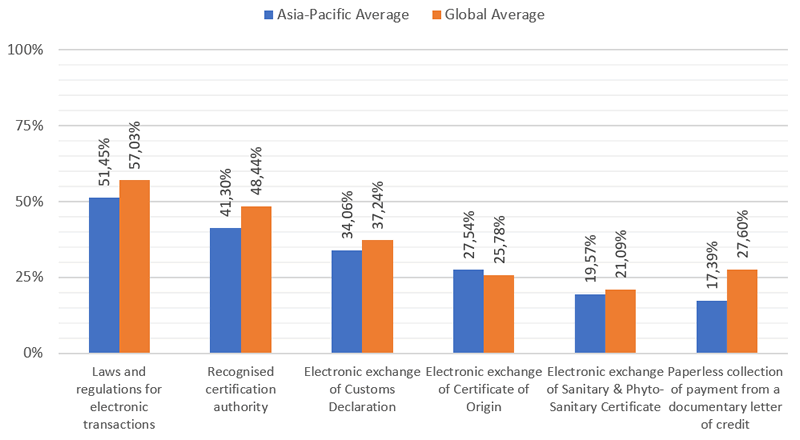
Again, the global and Asia-Pacific implementation rates of cross-border paperless trade measures follow similar patterns. Figure 4 shows that countries have made progress in implementing Laws and regulations for electronic transactions, with more than 60% of the countries having partially or fully developed relevant legal frameworks. Measures such as Electronic exchange of Sanitary & Phytosanitary Certificate and Paperless collection of payment from documentary letter of credit achieve very low regional implementation rates, showing that there is a lack of institutional and legal frameworks to support cross-border paperless trade and establish paperless systems. The Asia-Pacific region exceeds the global implementation rate for one cross-border paperless trade measures: the electronic exchange of certificate of origin; this is in large part due to the progress made by ASEAN economies in this area since 2018.
Way forward
While the global average implementation of paperless trade measures has reached 60%, the global average implementation level of cross-border paperless trade remains substantially lower than the other groups of measures considered. Significant progress has been made in cross-border paperless trade’ over the past two years with, for example, the ASEAN Single Window going “live” among five countries in late 2018.[iii] Several countries have also initiated bilateral exchange of one or more trade documents. More than twenty-five countries in the region also came together in 2019 to develop an implementation roadmap for the Framework Agreement on Facilitation of Cross-Border Paperless Trade in Asia and the Pacific, a UN treaty adopted at ESCAP to build upon existing bilateral and subregional initiatives.[iv] However, implementation remains mostly at the pilot stage. This is not surprising given that, on the one hand, many developing countries are at an early stage of developing paperless systems and on the other hand, more advanced countries have legacy systems in place that are not readily made to be interoperable.
The ESCAP Interim Intergovernmental Steering Group on Cross-Border Paperless Trade Facilitation has developed legal and technical checklists for countries to assess their readiness for cross-border paperless trade, identify gaps and develop action plans. ESCAP, with the support of China and the Enhanced Integrated Framework (EIF) has already conducted readiness assessments on the basis of the checklists in eight countries so far, namely Armenia, Bangladesh, Cambodia, Mongolia, Myanmar, Timor Leste and Uzbekistan. Other countries may also use the checklists and other tools developed by the Steering Group to appraise their levels of readiness and develop recommendations for accelerated implementation of cross-border paperless trade measures.[v]
[i] UN Global Survey on Digital and Sustainable Trade Facilitation, available at https://untfsurvey.org/ (accessed 18 November 2018).
[ii] Data about the global implementation rates is from the Digital and Sustainable Trade Facilitation Global Report, United Nations (2019), available at https://www.unescap.org/resources/digital-and-sustainable-trade-facilitation-global-report-2019 (accessed 18 November 2019).
[iii] The Agreement to Establish and Implement the ASEAN Single Window was signed in December 2005. However, live ASW operations started in 2018 among five members. See: https://asw.asean.org
[iv] https://www.unescap.org/resources/framework-agreement-facilitation-cross-border-paperless-trade-asia-and-pacific
[v] Readiness Assessments for Cross-Border Paperless Trade, UN ESCAP (2019) and related Country reports, available at https://www.unescap.org/resources/readiness-assessments-cross-border-paperless-trade (accessed 18 November 2019).
For further information you may contact:
Yann Duval (Chief, Trade Policy and Facilitation Section), Trade Investment and Innovation Division, UN ESCAP duvaly@un.org
Danijel Bajt (Intern, Trade Policy and Facilitation Section), Trade Investment and Innovation Division, UN ESCAP danijel.bajt@un.org / danijelbajt@gmail.com