Written by: Aurelio Martinez, Article No. 95 [UNCTAD Transport and Trade Facilitation Newsletter N°96 - Third Quarter 2022]
If, in a simplified way, we assume that a state-of-the-art container ship costs 200 M$, has an operational life of 20 years and works 365 days and 24 hours/day, its depreciation represents a cost of 1,142 dollars/hour. If we add other fixed operating costs, it is easy to assume that the hourly cost of such a ship could be between $1,500 and $2,000 per hour.
It is not surprising that time optimisation and, in particular, the variable "layover time" has preoccupied shipowners and researchers for more than 50 years. The first attempts to quantify this indicator were made by UNCTAD in the 1970s. Since then, there have been a multitude of initiatives, more or less successful, in search of a synthetic indicator that adequately reflects the scaling times required by ships in their logistics operations.
If this information is properly broken down, reflecting the different components that determine the total time, the usefulness of this database is vital when measuring productivity, analysing the time lost between the different port operations, seeing the time dynamics, where the critical phases of the whole process are, etc.
However, this disaggregation is not easily available, among other things, because it requires considerable thoroughness in its collection and, above all, because it shows the strengths and weaknesses of each port throughout the process and it is not always in the interest of the managers to show the internal shortcomings.
In any case, the times of scale are the basic variables on which to base any subsequent analysis of efficiency or port management. However, to reach more definitive conclusions, it is not only stopover times that are not enough, but there are also many other variables that influence the effectiveness and efficiency of ports, as the different investigations carried out in this field have shown, some of which can be summarised as follows:
- The order of the ship's calls (higher productivity in the first calls than in the later ones).
- The degree of automation of the port in all its operations.
- The capacity of cranes and the number of them.
- How modern the equipment is.
- Size of the ship.
- Number of movements per call.
- Extent of the yard.
- Degree of yard utilisation (congestion vs. under-utilisation).
- Length of berths.
- Percentage of transhipment over total movements.
- Private or public management.
- The way the workforce is recruited and organised.
- The degree of computerisation of processes.
- The provision of land-based infrastructures, etc.
Each researcher uses a combination of these when extracting results on effectiveness, efficiency, productivity, appropriate management or profitability obtained. It is therefore very risky to establish port classifications with models that include few variables, with many "missing values", few ports of call, few shipping lines and, above all, discarding some that have been shown to be strategic in other research. Normally, moreover, these models are based on an observation of reality through indirect sources (such as vessel position monitoring) and not on a direct measurement of variables such as stopover times.
Port of Valencia port call times
In the case of Valencia, In the case of Valencia we have only considered in this initial phase to provide to the port community what are our port call times, with a level of disaggregation that we consider basic, for all the relevant traffic in our port and a more extensive detail on the size of the ships that make up our first port traffic (containers). We have left for the future the issues of management, productivity or critical points in our information chain. We have also sought comments, criticisms and assessments from our port community in order to identify, via users and service providers, any weaknesses or inconsistencies in the information collected.
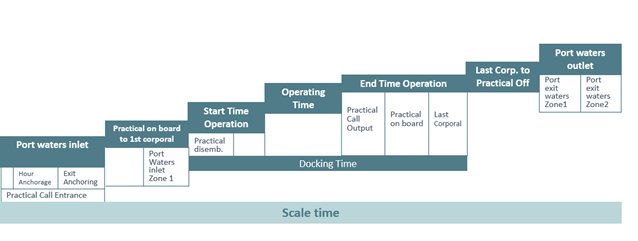
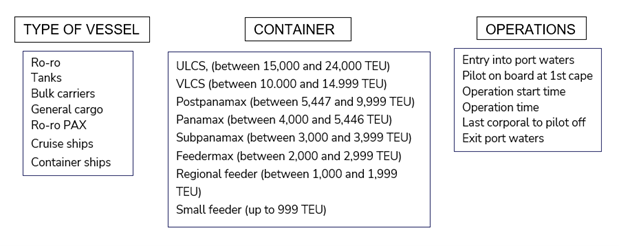
The first step was to agree on the key times that were relevant to measure and whose measurement could be recorded in a consistent manner, which is key to be able to make an analysis with an extensive time base. In the case of Valencia, these times have been delimited as shown in the following diagram. It shows some of the variables resulting from the measurements, such as stopover times, berthing times and the different times linked to the operation. The timeline of the different times measured is also shown.
Definitions
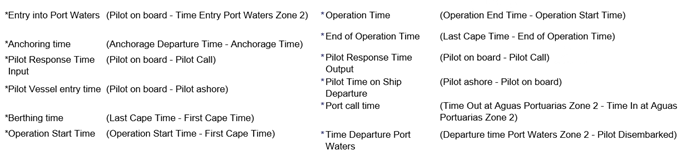
The information has been provided by the Maritime Traffic Control for scale and includes the years 2019, 2020 and 2021.
These are average traffic figures for all terminals and shipping companies operating in the port, in order to preserve the confidentiality required for this type of work.
Finally, the times are differentiated according to whether or not there have been anchorages, which are counted separately.
Vessels that deliberately delay their entry into port or into the anchorage area (drifting) are not included. In any case, both anchorages (which are included) and drifting (which are not included) have not been very relevant during these 3 years of data collection. Times are expressed in hours and minutes.
First results
The information has been collected consistently over the last three years. We therefore have data that allow us to see a certain evolution in some variables, but also a certain consistency in others. By way of example, some initial results are as follows:
- Of the 5,793 ports of call analysed during the year 2021, 16.6% of them (959) have been ports of call with anchoring. The percentage is somewhat higher in the case of container ships (26.6%).
- The number of anchorages includes those cases in which, for whatever reason, there is more than one anchorage in the same call. The majority of anchorages occur because the terminal is not ready (48%) or because of differences between the planned berthing date and the arrival date (33.5%).
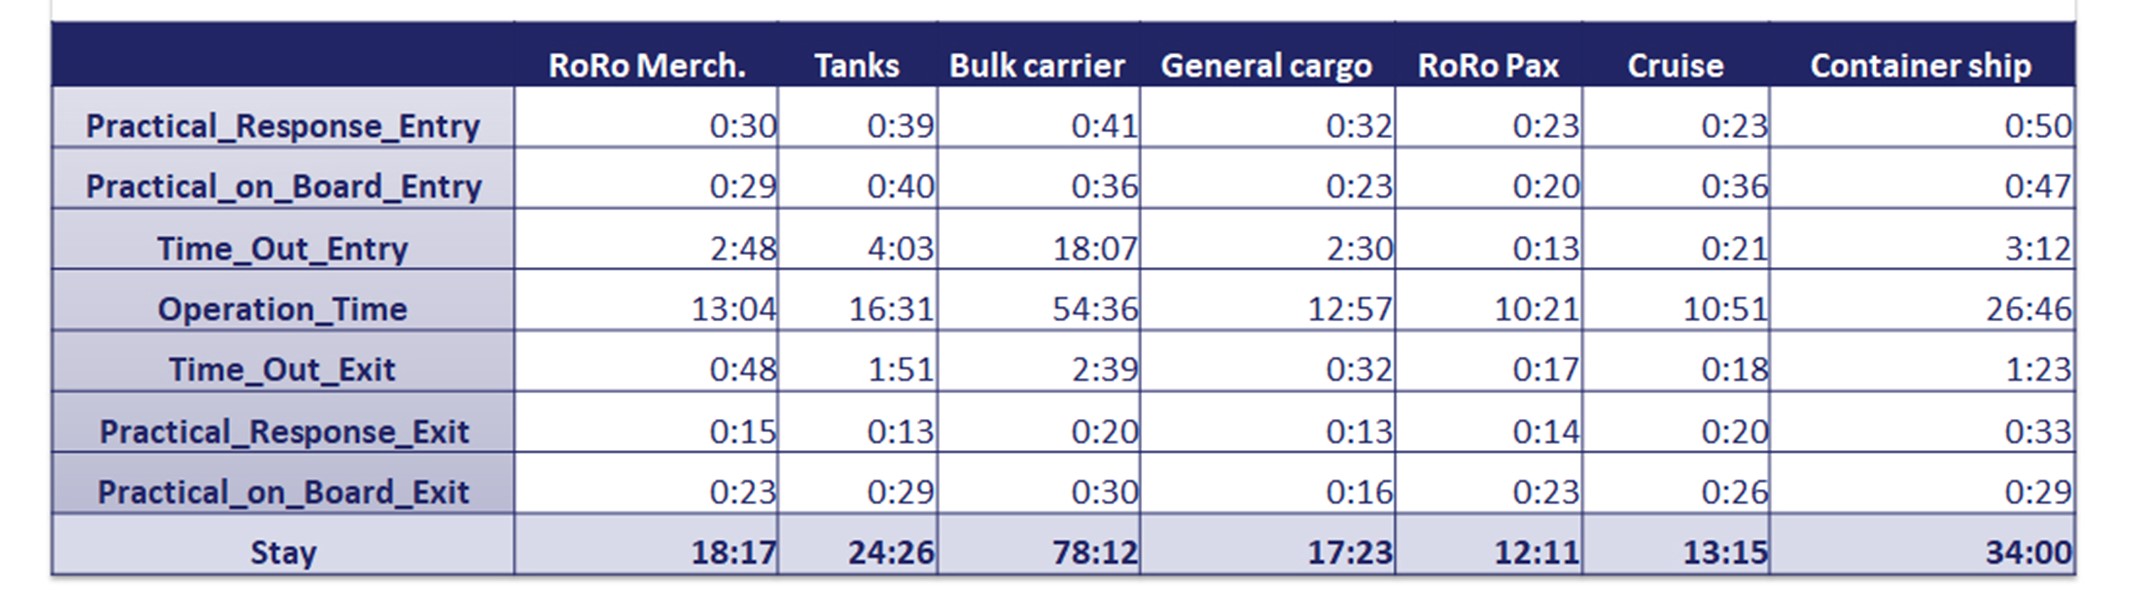
- Table 1 shows the times for each operation by type of ship, broken down by calls with and without anchorage. In the latter case, the times range from 12 hours and 11 minutes for the RoRo Pax to 78 hours and 12 minutes for bulk carriers. The largest time consumption, of course, is the operating time in all cases.
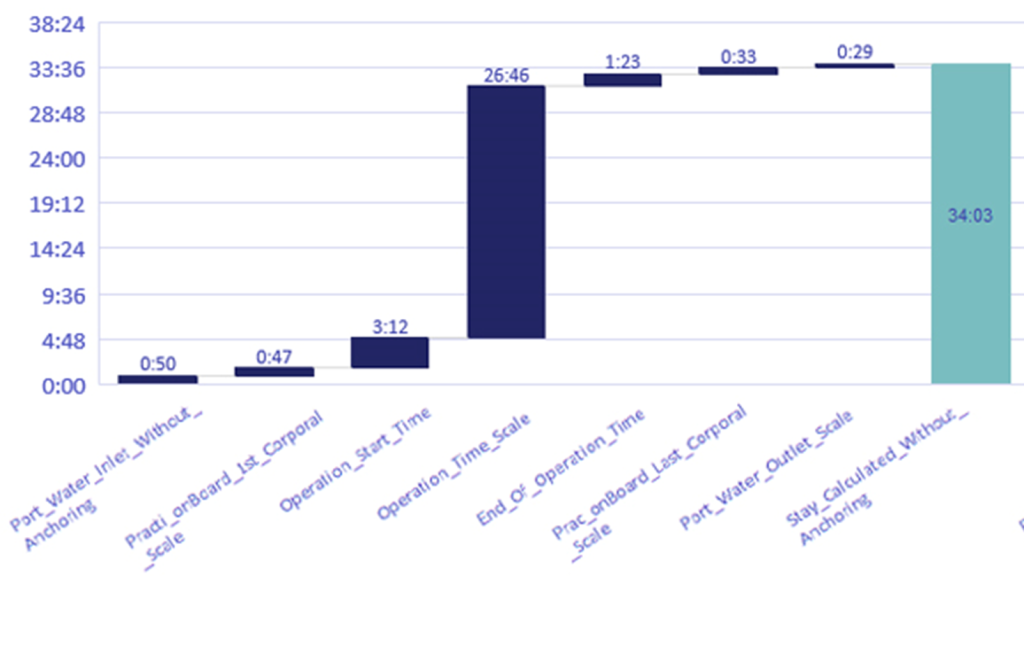
- Graphs 1 and 2 show the cumulative average times of container ships in 2021, separating anchored and non-anchored calls.
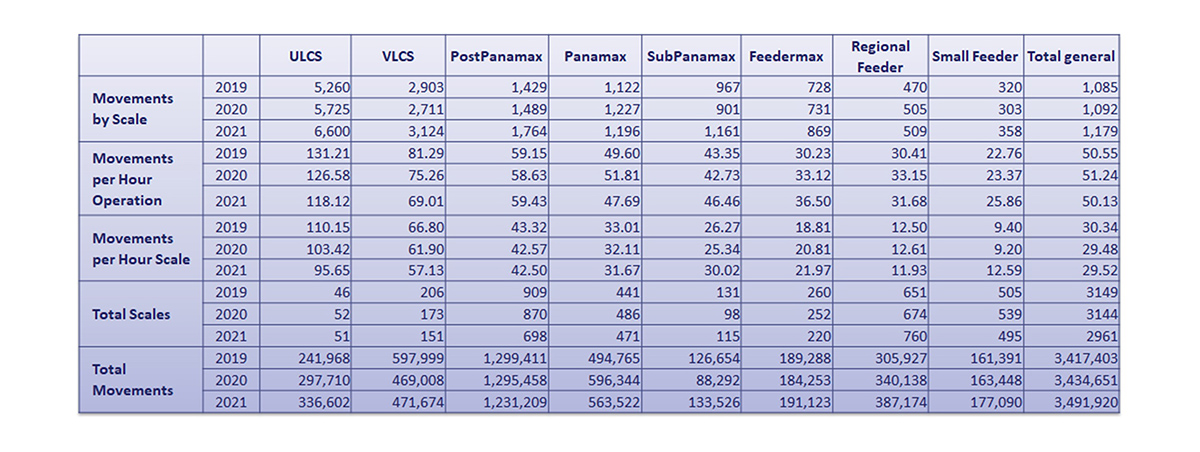
- Table 2, referring exclusively to container ships, contains information that we consider key and complementary in order to explain the evolution of port call times during these three years in this type of traffic.
For example:
- There has been an increase in the movements per call (10% in only two years).
- This increase is much more significant in the case of Ultra Large vessels (25.5%). The crisis has led to the concentration of cargo on mega-ships.
- However, the movements per hour of call are slightly reduced, which could mean either lower productivity or the impact of incipient port congestion.
- On the other hand, comparing operating time with berthing time, an improvement can be seen that could be attributed to an increase in operating time without the ship being operational, or to a reduction in berthing time due to greater speed in the rest of the operations.
- There has been an increase in the movements per call (10% in only two years).
Next steps
The following steps are being taken to obtain all the conclusions that such a large database provides us with. Firstly, to present the work to the port community in order to offer them the information and, above all, to compare the consistency of the information and to obtain their comments and indications.
From this first confrontation, we have obtained many contributions that will allow us to improve the work and make it more useful for everyone. The observations cover the whole spectrum of the work and will be fundamental for future reformulations. Among others, the following should be highlighted:
- Reducing the categories of ships analysed to 3 or 4 to make them more comparable with other international statistics.
- Include other variables such as productivity per ship or productivity per quay.
- It is not enough to consider anchoring times; drifting should also be included.
- Include other times such as dock change or bunkering.
- Reduce the number of general processes.
- It is important to introduce the variable congestion.
- The statistics should be based on movements, not on TEU's, etc.
The decision for the future is multiple. Either, we adapt the information we already have, including some of the variables mentioned above. Or we publish two series, the one already produced, in order to be able to establish internal comparisons, and the new one, with external comparisons in mind.
Conclusions
Information on port call times is relevant in the entire decision-making process of shipping lines and other operators. This is evidenced by the different initiatives in which the main shipping lines are working to improve the knowledge of the process, such as the constitution of the Digital Container Shipping Association (DCSA), or the International Taskforce for Port Call Optimisation.
In this sense, a standardization of the variables and times to be measured is key, as well as the systematics of such measurements. From the Port of Valencia, we wanted to advance and propose a first scheme, as well as to share the results with the Port Community.
We understand that, if this type of initiative becomes generalized, a real benchmarking tool will be available based on contrasted measurements, which will allow progress to be made in improving the competitiveness of port call times.
In any case, the system is under continuous improvement, based on the requests and contributions of the members of the Port Community with the aim of making it a management tool for the terminals and shipping companies that call at the Port of Valencia.
Of course, in the process of digitization in which the sector is embarked, increasingly and thanks to the Port Collaborative Decision Making (or Port CoM) tools, this data can be automated and shared in real time. This is the case of the Paula System, currently under development at the Port of Valencia, which in the future will allow the system to operate unattended.
We understand that, from the results obtained, in general the times are very tight, and the anchorage cases are quite limited, which allows us to venture that the Port of Valencia is possibly a very competitive port as far as port of call time is concerned, an advantage that is added to its geostrategic position (very limited deviation from its "fun line" or Suez - Gibraltar axis), its easy accessibility or the high capacity to generate export/import traffic to the users (the shipping companies?) of the port.
In any case, it would be interesting to agree on a similar methodology with other ports with similar logistic structures in order to be able to establish comparisons and to be able to extract the maximum benefit from the statistical effort of the compilation effort carried out.
TABLE Nº 1. Breakdown of call times by type of vessel
GRAPH Nº 1. Average time for container vessels without anchorage
GRAPH Nº2. Average time for container ships with anchorage
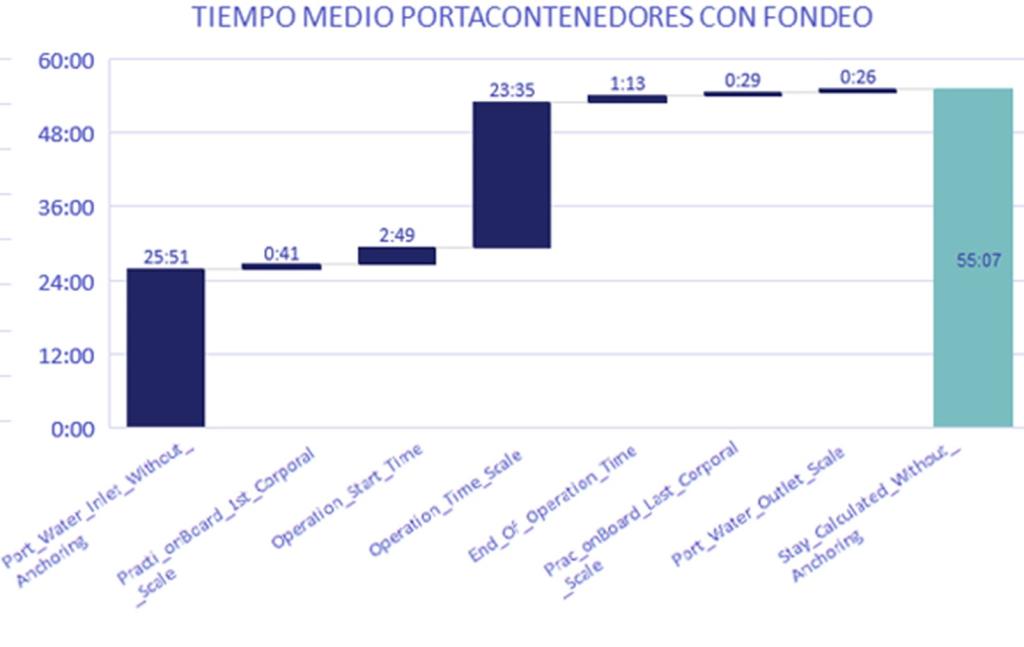
TABLE Nº 2: Movements/hour