| EMBARGO The contents of this Report must not be quoted or summarized in the print, broadcast or electronic media before 22 September 2004 17:00 GMT (1 PM New York, 19:00 Geneva, 22:30 Delhi,02:00 - 23 September Tokyo) |
Africa´s foreign direct investment inflows grew by 28% to $15 billion in 2003, and "further growth is expected this year", said Carlos Fortin, Deputy Secretary-General of UNCTAD, today, releasing UNCTAD´s World Investment Report 2004: The Shift Towards Services(1). The region´s quick turnaround from a downturn in 2002 was led by investment in natural resources and made easier by liberal foreign direct investment (FDI) policies.
Inflows regain momentum
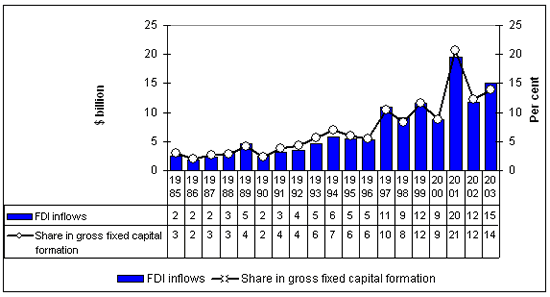
Altogether, 36 African countries registered an increase in FDI inflows last year, while 17 saw a decline. Inflows as a percentage of gross fixed capital formation grew from 12% in 2002 to 14% in 2003, the second highest level in the past decade (figure 1). The value of cross-border mergers and acquisitions (M&As) involving African firms rose from $4.7 billion in 2002 to $6.4 billion in 2003. The resource-rich countries were once again the main attraction for transnational corporations (TNCs).
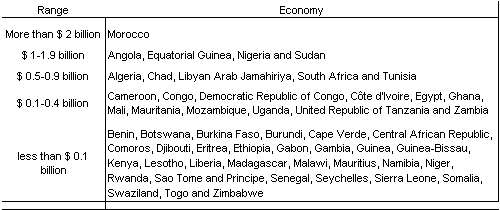
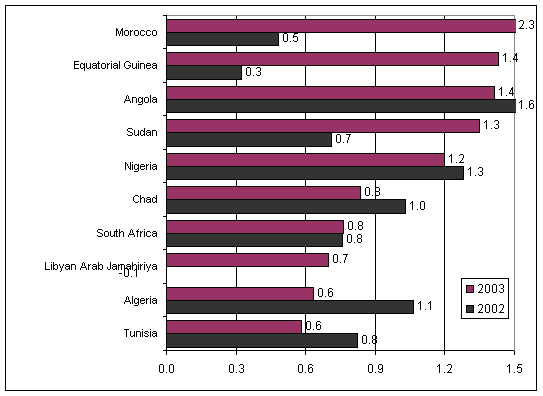
Last year Morocco was Africa´s largest recipient of FDI inflows, which climbed from $0.5 billion in 2002 to $2.3 billion in 2003, thanks to its privatization programme (figure 2). Angola, Equatorial Guinea, Nigeria and Sudan - all resource rich - also performed exceptionally well, each receiving inflows in excess of $1 billion (table 1). Morocco and these four countries led the region´s list of the 10 largest recipient countries of FDI inflows in 2003 (figure 2).
Several small African economies also shared in the growth of FDI inflows to the continent, partly because of modest increases in inflows to the manufacturing and services sectors. As a result, inflows were distributed more broadly than in any year since 1999, with 22 countries receiving more than $0.1 billion, as compared to 16 countries in 2001 (table 2).
Outward FDI from African countries remains small, and only seven of the region´s TNCs - all based in South Africa - are among UNCTAD´s top 50 TNCs based in developing countries (table 2).
Policies favour FDI
Favourable national policies were complemented by the conclusion of 35 bilateral investment treaties and nine double taxation treaties, as well as by negotiations on free trade agreements among groups of African countries and other countries/regions, particularly the United States and European Union. The extension of the US African Growth and Opportunity Act (AGOA) to 2015, through the AGOA Acceleration Act of 2004, should facilitate the expansion of international production in Africa.
Prospects are positive
"Africa´s outlook for FDI in 2004 and beyond is promising, given the region´s natural-resource potential, buoyant global commodity markets and improving investor perceptions of the region", said Karl P. Sauvant, Director of UNCTAD´s Investment Division. Policies at all levels have improved, and economic factors are favourable. As a result, the continent´s FDI inflows are expected to increase again this year .
Much of this increase will come from investment in natural resources. Hence, the region´s natural-resource-rich countries, such as Algeria, Angola, Equatorial Guinea, Mauritania, Mozambique, Nigeria and Sudan, are expected to receive more FDI. Of the leading TNCs surveyed by UNCTAD early this year, two thirds believed that inflows would remain unchanged, while one out of five respondents expected higher inflows over 2004-2005.
| The World Investment Report and its database are available online at www.unctad.org/wir and www.unctad.org/fdistatistics . A complete set of UNCTAD´s major publications on FDI and TNCs - the UNCTAD/UNCTC Digital Library - can be found at http://unctc.unctad.org |
ANNEX
Tables and figures
Table 1. Africa: country distribution of FDI inflows, by range, 2003

Source: UNCTAD, World Investment Report 2004
Table 2. The top 7 non-financial TNCs from developing economies in Africa, ranked by foreign assets, 2002 (Millions of dollars, number of employees)

Source: UNCTAD, World Investment Report 2004
Note: a The rank corresponds to the rank of each company in the list of the largest TNCs from developing countries; see WIR04, chapter I.
b "TNI" is the abbreviation for "Transnationality Index". The Transnationality Index is calculated as the average of the following three ratios: foreign assets to total assets, foreign sales to total sales and foreign employment to total employment.
Figure 1. Africa: FDI inflows and their share in gross fixed capital formation, 1985-2003

Source: UNCTAD, World Investment Report 2004
Figure 2. The top 10 recipients of FDI inflows in Africa, 2002 and 2003 (Billions of dollars)

Source: UNCTAD, World Investment Report 2004


