| EMBARGO The contents of this press release and the related Report must not be quoted or summarized in the print, broadcast or electronic media before 22 July 2010,17:00 [GMT] (13:00 New York; 19:00 Geneva, 22:30 New Delhi, 02:00 - 23 July 2010 Tokyo) |
Geneva, 22 July 2010 - Foreign direct investment (FDI) flows to and from developed countries contracted by more than 40% in 2009 to $566 billion and $821 billion respectively, following a similar decline in the previous year, reports UNCTAD´s annual study of worldwide investment trends. Yet this decline was not as severe as the one during the previous economic downturn of 2000-2003.
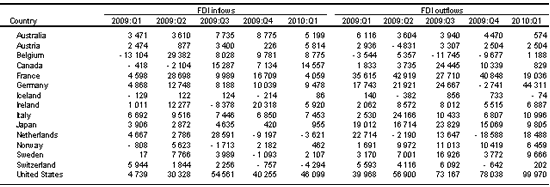
The World Investment Report 2010(1) , subtitled Investing in a Low-Carbon Economy, released today, indicates that FDI flows to developed countries were nevertheless four times higher in the first quarter of 2010 than in the same period in 2009 (table 1 for certain countries).
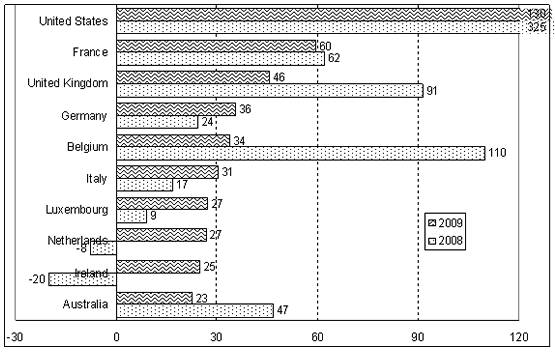
The global economic and financial crisis hit inward FDI of different regions unevenly. North America was most affected. Flows to the United States ? the largest host country in the world ? declined by 60%, while FDI flows to Canada more than halved. FDI flows to Japan also shrank by 51%. The 27 members of the European Union (EU) weathered the blow better (33%). Although FDI shrunk in some large host countries, such as the United Kingdom, Belgium and Spain, FDI flows increased to other major host economies, such as Germany, Ireland and the Netherlands. This yielded a different ranking of the largest recipient developed countries in 2009 (figure 1). While the bulk of FDI inflows to developed countries originated in other developed countries, transnational corporations (TNCs) from developing countries, too, became active investors in 2009.
Cross-border mergers and acquisitions, the main mode of FDI flows to and from developed countries, fell sharply in 2009 but are recovering in 2010. Greenfield investments were hit less, as they follow longer planning and investment periods and react less to shocks like the recent economic and financial crisis. Therefore, the value of cross-border M&As rose by 48% for the first five months of 2010 over the same period of the previous year, while the number of greenfield investments remained almost at the same level as in the same period in 2009 during the first four months.
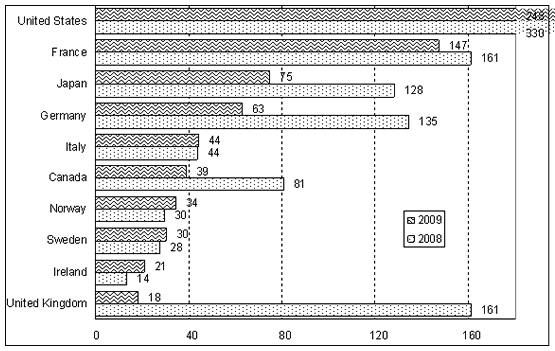
Outward FDI flows from developed countries declined by 48%. Falling profits and financial pressures resulted in depressed reinvested earnings, re-channelled dividends and withdrawn intra-company loans. Like recipients countries, the ranking of the largest investors is quite different in 2009 (figure 1).
The current crisis has made the question of outward FDI-related employment particularly important. Fast-growing outward FDI over the past decade has resulted in growing employment at the foreign affiliates of developed countries´ TNCs. In contrast, the impact of outward FDI on home-country employment is mixed. While outward FDI may reduce employment at home, particularly in the case of market-seeking FDI, it can save or create jobs if it leads to more exports for the home country, or better competitiveness for the investing firm. The impact also depends on the type of investment, the location of affiliates and TNCs´ employment strategies (table 2).
In 2009, a continued trend towards investment liberalization could be observed in developed countries, particularly in the air transport industry (Australia and between the EU and Canada). In addition, foreign investors benefited from State aid supplied in response to the financial crisis. However, in certain countries, screening requirements for foreign investment for national security reasons were tightened (Canada and Germany).
Prospects for FDI flows to developed countries have improved during the first half of 2010 thanks to economic recovery. In addition, large public debts can force some EU countries to engage in a new round of privatizations (e.g. Greece), opening the way for higher FDI inflows. On the other hand, the perception of increased risk of sovereign debt default in certain European countries and its possible transmission to the Eurozone could easily disrupt this upward trend.
The World Investment Report and its database are available online at http://www.unctad.org/wir and http://www.unctad.org/fdistatistics and http://www.unctad.org/diae |
ANNEX
Tables and figures
Table 1. Developed countries: FDI flows of selected countries, 2009-2010, by quarter (Millions of dollars)
Source: UNCTAD, World Investment Report 2010.
Table 2. Employment in foreign affiliates of home-based TNCs of selected developed countries, 1990-2007 (Thousand employees)
Source: UNCTAD, World Investment Report 2010.
a 1996
b 1991
c 2001
d 2002
e Data refer to majority-owned affiliates only
Figure 1. Developed economies: top 10 recipients and sources of FDI flows, 2008, 2009a (Billions of dollars)
a) Inflows

b) Outflows

Source: UNCTAD, World Investment Report 2010.
Note: a Ranked on the basis of the magnitude of 2009 FDI flows.


