| EMBARGO The contents of this press release and the related Report must not be quoted or summarized in the print, broadcast or electronic media before 16 October 2006, 17:00 GMT (1 PM New York, 19:00 Geneva, 22:30 Delhi, 02:00 - 17 October Tokyo) |
Global foreign direct investment (FDI) inflows rose substantially in 2005, the second rise in two years. This growth was spurred by cross-border mergers and acquisitions (M&As), which reflected strategic choices by transnational corporations (TNCs) following increased corporate profits and the recovery of stock markets. "Current growth is broad-based with inflows rising in 126 out of some 200 economies, reflecting high economic growth and strong economic performance in many parts of the world" said Dr. Supachai Panitchpakdi, Secretary-General of UNCTAD, introducing the organization´s World Investment Report 2006 (1). The report, subtitled FDI from Developing and Transition Economies: Implications for Development, was released today.
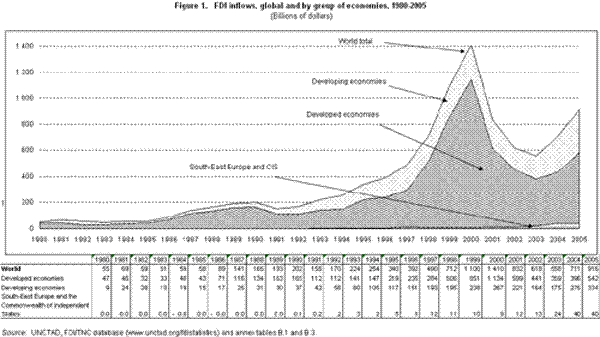
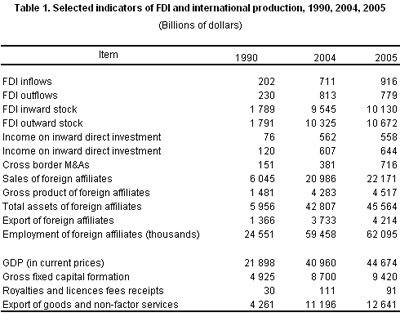
At US$916 billion, global FDI inflows were 29% higher than in 2004 (table 1). Flows to developed countries rose by 37% to US$542 billion. Those to developing countries surged by another 22% in 2005 to reach a record US$334 billion. In percentage terms, developed countries attracted 59% of global FDI, developing countries attracted 36% and South-East Europe and the Commonwealth of Independent States (CIS) accounted for the remaining 4% (figure 1).
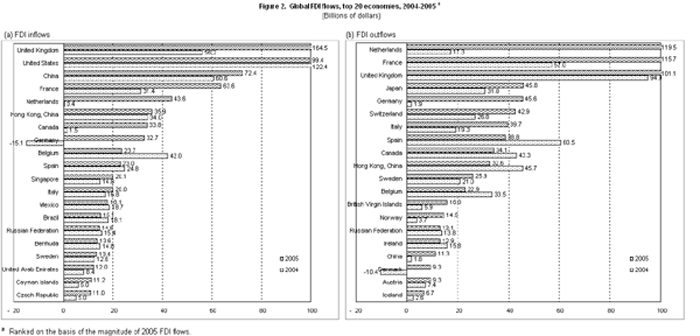
The largest recipient country was the United Kingdom, followed by the United States and China. Members of the EU were well represented as recipient countries; while nine of the 20 economies with the largest FDI inflows were developing or transition economies (figure 2). FDI is carried out by transnational corporations (TNCs) mainly through cross-border M&As in recent years. M&A activity in 2005 rose to a level approaching that of the M&A boom at the end of the 1990s.
Among developing regions, the highest growth rate in inward FDI was seen in West Asia (85%), followed closely by Africa (78%), both regions experiencing record inflows of US$34 billion and US$31 billion respectively. FDI inflows in the 50 least developed countries also recorded a historic high of US$10 billion. South, East and South-East Asian economies remained the largest recipients among developing countries, with a 20% increase for the region as a whole. In Latin America and the Caribbean, on the other hand, there was only a 3% increase, a much lower growth rate than in 2004. (For individual developing regional trends in FDI, see UNCTAD/PRESS/PR/2006/028 to 033).
In South-East Europe and the CIS, FDI inflows remained almost at the same level as in 2004 (see UNCTAD/PRESS/PR/2006/033). In developed countries, the increase was particularly marked in the EU, but there were major variations in FDI performance among countries. As a result of some major M&A transactions, FDI flows to the EU-15 shot up by 109% (to US$388 billion), while flows to the 10 new EU Members rose by 19%. Among other non-EU countries, Canada accounted for most of the increase in North America, while FDI inflows to Japan fell by 64% to US$2.8 billion, the lowest level since 1996 (see UNCTAD/PRESS/PR/2006/029).
Developing countries, as emerging sources of FDI, strengthened their global position in 2005, investing US$117 billion. "A number of TNCs from developing economies are emerging as major players on the world stage - and they are here to stay. This represents a profound change in the global economy and will have substantial consequences for international economic and political relations" said Anne Miroux, head of the team that produced the UNCTAD report. "Developing-country TNCs are seeking to improve their competitiveness by expanding in the fast-growing markets of emerging economies, as well as in developed country markets, and by seeking new ways to reduce costs" (see UNCTAD/PRESS/PR/2006/034).
Higher prices for many commodities have further stimulated FDI in developing countries rich in natural resources - another trend likely to continue. This has influenced FDI by developing country TNCs, both by companies aiming to secure supplies of natural resources and those able to take advantage of high revenues from commodities. The most notable growth in developing-country FDI outflows was from China and West Asia. A key driver of Chinese outward FDI is the country´s growing demand for natural resources, as suggested by its investment projects in this sector in Latin America and Africa. The emergence of developing countries and the transition economies of South-East Europe and the CIS as significant outward investors is examined in detail in this report (see UNCTAD/PRESS/PR/2006/033).
Developed countries continued to account for the bulk of FDI outflows. In fact, almost half of all FDI originated from three countries: the Netherlands, France and the United Kingdom in that order (figure 2). FDI outflows from the Netherlands resulted mainly from the merger of Royal Dutch Shell of the Netherlands with Shell Transport and Trading Company of the United Kingdom. Outward FDI from France doubled to US$116 billion in 2005, and companies located in the United Kingdom invested US$101 billion abroad. Other major investors were companies from Germany and Spain.
Cross-border M&As have spurred the recent increases in FDI. They rose by 88% in value to US$716 billion. The number of deals increased by 20% over 2004, to 6,134. These levels are close to those achieved in the first year of the cross-border M&A boom of 1999-2001. There were 141 mega deals valued at more than US$1 billion - close to the peak of 2000, when 175 such deals were observed. A new feature of the M&A boom is increasing investment by collective investment funds, mainly private equity and hedge funds. These funds, largely concentrated in the United States and the United Kingdom, accounted for US$135 billion in M&As in 2005, or 19% of total cross-border M&As. Unlike other kinds of FDI, private equity firms tend not to undertake long-term investments, and exit their positions within 5 to 10 years (or an average of 5-6 years), long enough not to be regarded as typical portfolio investors. The report speculates that this trend raises questions about the implications of such investments for the long-term growth and welfare of host economies.
FDI grew in all sectors. While services remained the dominant sector, the report shows that the primary sector gained in importance in 2005. Cross-border M&As in this sector rose more than six fold. Cross-border M&As involving companies in mining and oil accounted for the bulk of the primary-sector FDI. By contrast, the share of the manufacturing sector in the total fell in 2005.
| The World Investment Report and its database are available online at http://www.unctad.org/wir and http://www.unctad.org/fdistatistics |
ANNEX
Tables and figures
Figure 1. FDI inflows, global and by group of economies, 1980-2005 (Billions of dollars)
Source: UNCTAD, World Investment Report 2006
Figure 2. Global FDI flows, top 20 economies, 2004-2005a (Billions of dollars)
Source: UNCTAD, World Investment Report 2006
Note: a Ranked on the basis of the magnitude of 2005 FDI flows.
Table 1. Selected indicators of FDI and international production, 1990, 2004, 2005(Billions of dollars)
Source: UNCTAD, World Investment Report 2006


