| EMBARGO The contents of this Report must not be quoted or summarized in the print, broadcast or electronic media before 22 September 2004 17:00 GMT (1 PM New York, 19:00 Geneva, 22:30 Delhi,02:00 - 23 September Tokyo) |
"Prospects for a further rise in foreign direct investment flows to Asia and the Pacific in 2004 are promising", said Carlos Fortin, Deputy Secretary-General of UNCTAD, today, releasing UNCTAD´s World Investment Report 2004: The Shift Towards Services(1). Foreign direct investment (FDI) flows to the region rebounded in 2003, and China became the world´s largest host country. Regional integration is encouraging intraregional investment. While the services sector continues to account for the largest share of FDI inflows in the more developed Asian economies, FDI in manufacturing should increase this year in response to a rise in world demand and growth of industrial activities, the Report says.
Mild upturn
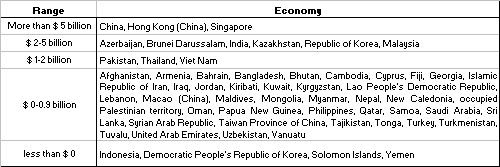
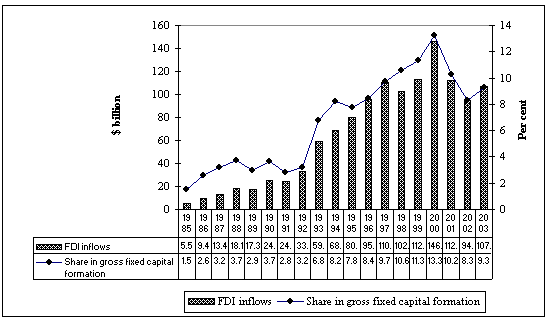
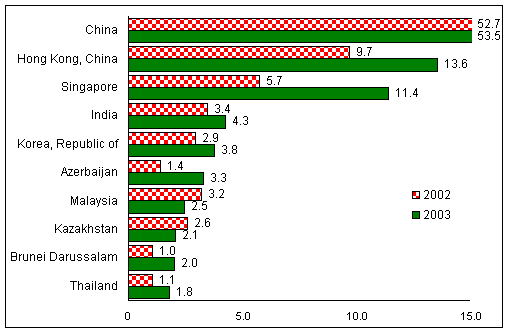
FDI flows to Asia and the Pacific rose from $94 billion in 2002 to $107 billion last year, ending the downturn that began in 2001 (figure 1). Ten economies accounted for 90% of those inflows (figure 2). Overall, 34 economies received higher inflows, and 21 lower ones, than in the previous year. FDI inflows as a percentage of gross fixed capital formation were also up, from 8% in 2002 to 9% in 2003 (figure 1). The region showed greater resilience than other developing regions and attracted more FDI than the others. However, flows to individual economies continued to be unevenly distributed, with most economies receiving less than $1 billion (table 1):
- FDI flows to North-East Asia(2) expanded from $67 billion in 2002 to $72 billion in 2003. Excluding Luxembourg (because of transhipped FDI), China became the largest FDI recipient worldwide ($54 billion), as flows to the United States, the traditional leader in inward FDI flows, plunged in 2003.
- Regional economic growth and an improved investment environment contributed to a 27% increase in FDI flows to the South-East Asia subregion(3), from $15 billion in 2002 to $19 billion in 2003.
- South Asia(4) received $6.1 billion in FDI flows last year, up from $4.5 billion in 2002. FDI flows to India, the largest host country in the subregion, rose by 24%, reflecting its strong growth and continued liberalization.
- Central Asia(5) recorded an increase in FDI inflows from $4.5 billion in 2002 to $6.1 billion in 2003.
- Flows to West Asia(6) also rose, from $3.6 billion in 2002 to $4.1 billion in 2003. The main reason was increased oil investments.
- Flows to the Pacific Islands doubled, from $0.1 billion in 2002 to $0.2 billion in 2003, driven by a significant increase in flows to Papua New Guinea.
Intra-regional investment is growing, partly because of the shift of production from higher to lower-cost locations within the region. Regional integration arrangements also influenced investment within these subregions and accelerated the process of knitting the region into more widespread production networks.
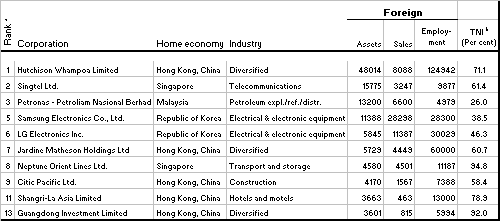
China and India are joining Malaysia, the Republic of Korea, Singapore and Taiwan Province of China as sources of FDI. Asian companies dominate the list of the 50 largest transnational corporations (TNCs) from developing countries, with 32 of the total; among the top 10 Asian TNCs, half are from Hong Kong, China (table 2).
Services dominate
The proportion of services in the region´s total FDI stock climbed from 43% in 1995 to 50% in 2002. The newly industrializing economies of the region and the ASEAN member States led the way. The share of services in total FDI flows in ASEAN countries, for instance, expanded from 30% in 2002 to 48% in 2003. FDI in services has also grown in less developed countries (e.g. Bangladesh and Pakistan) because of higher investment in infrastructure and utilities.
Within services, a major proportion of the region´s FDI goes to finance, transport, telecommunications and business services, particularly activities relating to information technology. Tourism is an important industry for FDI in such economies as Cambodia, Thailand and the Pacific Islands. Competition for FDI in high value-added services (e.g. regional headquarters and R&D) is becoming more intense among economies in North-East Asia and South-East Asia.
Promising prospects
"FDI inflows to the Asia-Pacific region are set to rise", says Karl P. Sauvant, Director of UNCTAD´s Investment Division. An improving global economic situation, a healthier outlook for key industries, subregional and regional developments and country-specific factors support this optimism. FDI in manufacturing should increase with improved world demand and growth of industrial activities in such areas as electronics and automobiles. Higher corporate profitability should encourage TNCs to raise their capital spending. Almost 60% of the TNCs and nearly 90% of the location experts surveyed by UNCTAD (see UNCTAD/PRESS/PR/2004/012 and UNCTAD/PRESS/PR/2004/005) expect an improvement in FDI prospects over 2004-2005. In particular, prospects for China, India and Thailand were considered bright.
| The World Investment Report and its database are available online at www.unctad.org/wir and www.unctad.org/fdistatistics . A complete set of UNCTAD´s major publications on FDI and TNCs - the UNCTAD/UNCTC Digital Library - can be found at http://unctc.unctad.org |
ANNEX
Tables and figures
Table 1. Asia and the Pacific: economy distribution of FDI inflows, by range, 2003

Source: UNCTAD - World Investment Report 2004
Table 2. The top 10 non-financial TNCs from developing economies in Asia, ranked by foreign assets, 2002 (Millions of dollars, number of employees)

Source: UNCTAD - World Investment Report 2004
Note: a The rank corresponds to the rank of each company in the list of the largest TNCs from developing countries; see WIR04, chapter II.
b "TNI" is the abbreviation for "Transnationality Index". The Transnationlity Index is calculated as the average of the following three ratios: foreign assets to total assets, foreign sales to total sales and foreign employment to total employment.
Figure 1. Asia and the Pacific: FDI inflows and their share in gross fixed capital formation, 1985-2003

Source: UNCTAD - World Investment Report 2004
Figure 2. The top 10 recipients of FDI inflows in developing Asia, 2002 and 2003 (Billions of dollars)

Source: UNCTAD - World Investment Report 2004


