| EMBARGO The contents of this press release and the related Report must not be quoted or summarized in the print, broadcast or electronic media before 22 July 2010,17:00 [GMT] (13:00 New York; 19:00 Geneva, 22:30 New Delhi, 02:00 - 23 July 2010 Tokyo) |
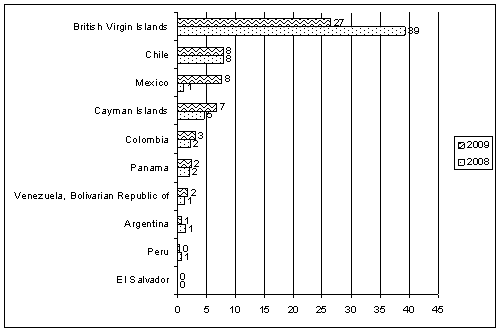
Geneva, 22 July 2010 - Foreign direct investment (FDI) outflows from Latin America and the Caribbean, excluding offshore financial centres, leaped from an average of $5 billion a year in 1991-2000 to an annual $24 billion in 2003-2008, before receding to $12 billion in 2009, according to UNCTAD´s World Investment Report 2010(1) , subtitled Investing in a Low-Carbon Economy, released today.
An increasing number of Latin American companies, mostly Brazilian and Mexican, have been expanding outside the region in recent years, primarily into developed economies. The region´s main foreign investors today (table 1) are often the largest and oldest business regional groups that prospered and consolidated their position during the import substitution era, and then achieved significant productivity gains during the economic liberalization of the 1990s. More recently, government incentives in Brazil, including targeted credit lines, have supported companies´ outward expansion. At the same time, Latin American TNCs will continue to benefit from their healthy corporate balance sheets, limited exposure to industries most affected by the crisis and the relative resilience of the region´s economy. Limited access to domestic financing, coupled with currently tight international financial markets, could hinder further expansion, however.
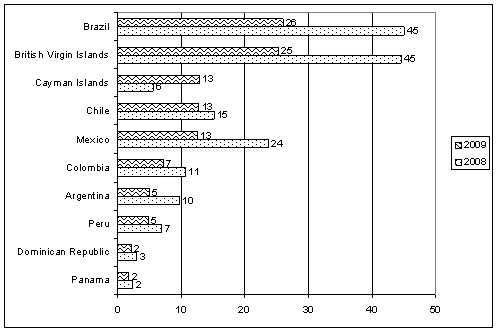
With regard to inward FDI, in 2009, the impact of the global economic and financial turmoil drove down FDI to Latin America and the Caribbean to $117 billion - a 36% decline from 2008. Although Brazil was more affected than the region on average, with a 42% contraction in inward investment, it remained the largest recipient (figure 1). The report says the decrease was partly due to the drop in reinvested earnings, which accounted for more than half of FDI inflows to the region. This fall is related to a general decline of total income from FDI, which fell from $94 billion in 2008 to $77 billion in 2009. The collapse of cross-border M&A sales also contributed to the FDI downturn. These sales turned negative in 2009 due to the increasing sales of foreign affiliates to domestic companies, particularly in Brazil.
In some parts of the region, governments strengthened the role of the State in the economy, partially through nationalisations. Targeted industries include the petrochemical industries, financial services and the energy sector (Bolivarian Republic of Venezuela, the Plurinational State of Bolivia). On the other hand, there were also moves towards further liberalization, including in the telecommunications sector (e.g. Bahamas, Costa Rica) and towards investment promotion (e.g. Mexico and Peru).
Prospects for FDI inflows to Latin America and the Caribbean are improving in 2010, as the region is recovering relatively rapidly from the global financial and economic crisis. Data on the first quarter of 2010 for selected economies in this region show that FDI inflows were nearly 20% higher than those in the same period of the previous year (table 2). Medium-term prospects also look promising, as Brazil and Mexico remain popular investment destinations according to investor surveys.
FDI outflows are expected to pick up in 2010, as outflows from Brazil are very likely to return to positive values after plunging to a negative $10 billion in 2009. The continued emergence of the region´s TNCs will continue to drive outward FDI in the medium term, UNCTAD predicts.
The World Investment Report and its database are available online at http://www.unctad.org/wir and http://www.unctad.org/fdistatistics and http://www.unctad.org/diae |
ANNEX
Tables and figures
Table 1. The top 10 non-financial TNCs from Latin America, ranked by foreign assets, 2008 (Millions of dollars and number of employees)
Source: UNCTAD, World Investment Report 2010.
Note:a TNI, the Transnationality Index, is calculated as the average of the following three ratios: foreign assets to total assets, foreign sales to total sales and foreign employment to total employment.
Table 2. FDI flows of selected economies in Latin America and the Caribbean, 2009-2010, by quarter
Source: UNCTAD, World Investment Report 2010.
Figure 1. Latin America and the Caribbean: top 10 recipients and sources of FDI flows,a 2008-2009 (Billions of dollars)
a) Inflows

b) Outflows

Source: UNCTAD, World Investment Report 2010.
Note: a Ranked on the basis of the magnitude of 2009 FDI flows.
Brazil is not among the top investors in 2009 due to negative investment.


