| EMBARGO The contents of this press release and the related Report must not be quoted or summarized in the print, broadcast or electronic media before 29 September 2005, 17:00 GMT (1 PM New York, 19:00 Geneva, 22:30 Delhi, 02:00 - 30 September Tokyo) |
After three years of decline, global foreign direct investment rose slightly in 2004. The rebound was the result of increased flows to developing countries; FDI in developed countries continued to fall. "Intense competitive pressures in many industries are leading firms to explore new ways of improving their efficiency," said Dr. Supachai Panitchpakdi, Secretary-General of UNCTAD, introducing the organization´s World Investment Report 2005: Transnational Corporations and the Internationalization of R&D (1). The report was released today and includes UNCTAD´s first-ever survey on research and development by transnational corporations.
At US$ 648 billion, global FDI inflows were 2% higher than in 2003 (table 1). But the global figure masks diverging trends. Flows to developing countries surged by 40% to reach US$ 233 billion - the second highest level ever recorded - while developed countries saw inflows decline by 14%, to US$ 380 billion. Some 36% of all FDI went to developing countries in 2004. Seven of the 10 economies with the largest increases in FDI were developing or transition economies, while the 10 largest declines were in developed countries (fig. 1). The United States remained the largest FDI recipient, followed by the United Kingdom and China (fig. 2).
"The high level of FDI to developing countries is likely to be sustained", said Anne Miroux, head of the team that produced the UNCTAD report. TNCs are seeking to improve their competitiveness by expanding in the fast-growing markets of emerging economies and by seeking new ways to reduce costs, she said. This is affecting the location of even highly knowledge-intensive activities, such as research and development (see UNCTAD/PRESS/PR/2005/033). Higher prices for many commodities have further stimulated FDI in those developing countries rich in natural resources- another trend likely to continue, she added.
Among developing regions, the largest increase in inward FDI was noted in Asia and Oceania (46%), followed closely by Latin America and the Caribbean (44%), while flows to Africa remained stable. FDI inflows to least developed countries rose to US$ 11 billion, the highest level ever for such nations, although at less than 2% of the world total, their share remains relatively small by global standards. The top five FDI recipients among developing countries were China; Hong Kong, China; Brazil; Mexico; and Singapore (for individual regional trends in FDI, see UNCTAD/PRESS/PR/2005/035-38).
There were major variations in FDI performance among developed countries, the report reveals. FDI flows to the US shot up by 62% (to US$ 96 billion), and flows to the UK more than tripled (to US$ 78 billion), partly because of an increase in large mergers and acquisitions in those countries. FDI flows to Australia also soared to a record US$ 43 billion, driven by equity investments and a rise in M&As.
EU trends varied sharply between the "EU-15" and the EU´s new members. In the former, inflows plunged by 40%, reaching their lowest levels since 1998. In some countries, such as Denmark, Germany and the Netherlands, the large declines were partly the result of repayments of intra-company loans and capital repatriation by parent companies. France, Ireland and Spain, which have registered large increases in recent years, also experienced significant declines in FDI flows in 2004. By contrast, FDI in all the new EU member countries rose to US$ 20 billion, almost 70% more than in 2003, with the Czech Republic, Hungary and Poland receiving the largest chunks of these inflows. The biggest investors in these countries were firms based in EU-15 nations, such as Austria, France, Germany and the Netherlands. But FDI in the European Union as a whole - including new EU members - plummeted by 38% (to US$ 216 billion) last year.
Developing countries look increasingly outwards
Developed countries continued to account for the bulk of FDI outflows. In fact, almost half of all FDI originated from three countries: the US, the UK and Luxembourg, in that order (fig. 2). Some developing countries, especially in Asia, also emerged as important sources of foreign direct investment. A key driver of Chinese outward FDI is the country´s growing demand for natural resources, as suggested by its investment projects in that sector in Latin America and Africa. In addition, the steel industry has become a major target of FDI flows among developing countries. The Tata Group (India), for example, invested US$ 2 billion in projects in Bangladesh, including a steel mill; Posco Ltd (Republic of Korea) agreed to invest US$ 8.4 billion in a steel project in India; and China´s Baosteel signed a framework agreement with Arcelor and CVRD to build a steel plant in Brazil for a total investment of US$8 billion. The report is predicting a continuing rise in FDI in natural resources and related activities, largely because of demand from rapidly developing economies in Asia.
Developing-country firms are expanding their activities in developed countries as well, the UNCTAD report notes. For example, there was Ambev´s (Brazil) acquisition of John Labatt (Canada) - the fifth largest cross-border M&A of 2004 -- and Lenovo´s (China) takeover of the personal computer division of IBM (United States). These and other developments suggest that firms from developing economies will be more active in acquiring corporate equities in developed countries, as evidenced by recent bids by Chinese firms to acquire companies in the US.
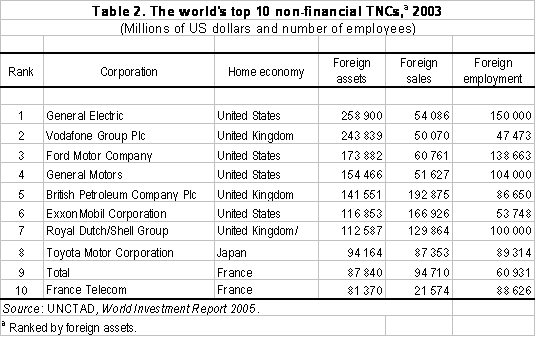
Still, among the top 100 TNCs ranked by foreign assets (see UNCTAD/PRESS/PR/2005/039), only four - led by Hutchison Whampoa (Hong Kong, China) - are based in developing economies. General Electric (US) remains the largest non-financial TNC worldwide in terms of foreign assets, followed by Vodafone (UK) and Ford Motor (US) (table 2). On average, the top TNCs have affiliates in 39 foreign economies, with the Netherlands and the United Kingdom being the most favoured host countries. Among developing countries, Brazil hosts the largest number of affiliates of the top 100 TNCs.
The continued expansion of TNCs - which have estimated foreign sales of US$ 19 trillion and employ some 57 million foreign workers (table 2) - is being paralleled by significant changes in national and international policy-making, the UNCTAD report observes. The general trend is to make national and regional economies more open and welcoming to foreign investors. However, with a view to extracting greater benefits from inward FDI, especially investment targeting natural resources, several Latin American and African countries have tightened their regulatory frameworks in this area.
| The World Investment Report and its database are available online at www.unctad.org/wir and www.unctad.org/fdistatistics . A complete set of UNCTAD´s major publications on FDI and TNCs - the UNCTAD/UNCTC Digital Library - can be found at http://unctc.unctad.org . |
ANNEX
Tables and figures
Figure 1: FDI inflows, global and by group of economies, 1980-2004 (Billions of US dollars)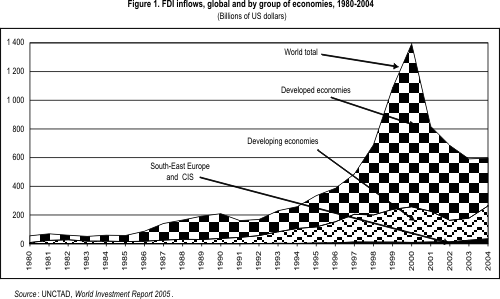
Figure 2: Economies with largest gains and declines in FDI inflows, 2003-2004 Billions of US dollars)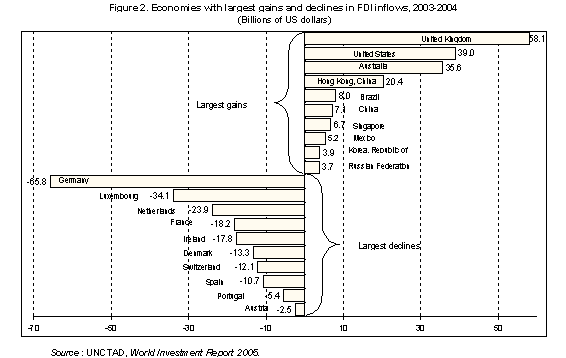
Figure 3: Global FDI flows, top 10 economies, 2003-2004 (Billions of US dollars)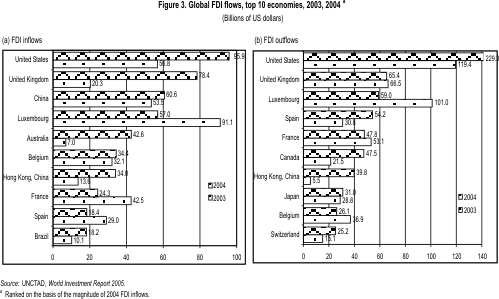
Table 1: Selected indicators of FDI and international production, 1990, 2003 2004 (Billions of US dollars)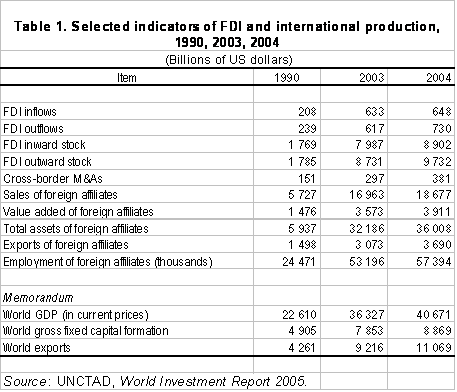
Table 2: The world´s top 10 non-financial TNCs, 2003 (Millions of US dollars and number of employees)