
International transport costs amounted to a country average of 9 per cent of the value of imports during the decade 2005–2014, according to the UNCTAD Review of Maritime Transport 20151. Globally, technological advances, economies of scale, improved trade and transport facilitation as well as more fuel efficient ships and trucks have all contributed to the trend of a long-term decline in international transport costs.
Among the main regional groupings, African countries paid the most (an average of 11.4 per cent), followed by Oceania (9.6 per cent), against an average of only 6.8 per cent for developed countries (see figure). UNCTAD has identified seven fundamental reasons behind the disparity in international transport costs and the relatively high cost of transport for African countries in particular:
1. Many countries in Africa are landlocked, depending not only on the procedures of their own customs and other border agencies, but also on those of neighbouring transit countries. Many countries in Africa also report low scores in indicators such as the Doing Business Index or the Logistics Performance Index.
2. Operating costs for vessel operators are the same overall, largely independent of routes or locations. These vary, however, depending on ship type and age. Routes with smaller and/or older vessels, such as those delivering most services that connect African countries, will have higher operating costs.
3. In continental Africa, some countries have been able to benefit from their geographical position and offer trans-shipment services. Egypt, for example, benefits from the traffic passing through the Suez Canal, and Mauritius and Morocco both have established important hub ports. Most other African countries, however, are relatively far from the major East–West shipping routes.
4. Several smaller African economies only provide relatively small markets. As a result, shippers may be confronted with oligopolistic markets, where low levels of competition may lead to higher prices.
5. The types of manufactured goods imported into African developing countries tend to be of relatively lower value – that is, on average the cars, clothes or tools imported into Africa are of lower per-unit value than those imported into Europe or North America. Hence, the cost of transport increases as a percentage share.
6. Many African developing countries are confronted with transport infrastructure bottlenecks. The largest ships that can be accommodated are far smaller than those that call at ports in other regions. Also, private sector participation through concessions is less frequent in developing countries in Africa. Both aspects empirically contribute to higher transport costs.
7. Most countries in Africa have a merchandise trade deficit. As a consequence, ships are more likely to arrive fully loaded and have spare capacity when returning to China, Japan or Europe. Freight rates for imports will thus be higher than freight rates for exports.
UNCTAD suggests that there is potential for policymakers to remedy the situation through investments and reforms, especially in seaports, transit systems and customs administrations.
The Review of Maritime Transport 2015 also examines trends in container freight rates, which remained volatile throughout 2014. The report identifies different trends in the rates charged on individual routes that container ships take around the world and concludes that, despite the expansion in global demand for container shipping, there was no significant change in the market fundamentals determining rates. This was because of constant supply pressures on market rates from the introduction of very large ships in main East–West routes and the transferral of smaller, older ships to non-main North–South and regional routes.
The tanker market, which encompasses the transportation of crude oil, refined petroleum products and chemicals, witnessed an equally volatile freight rate environment in 2014, the report says. As a whole, the Baltic index for crude oil (Baltic Dirty Tanker Index) progressed by 21 per cent in 2014, reaching 777 points, whereas the Baltic Clean Tanker Index remained almost at the same level as in 2013, with 607 points, compared to 605 in 2013. In 2014, freight rates for both crude and product carriers increased in general for all vessel segments. Demand outperformed supply for the first time since 2010, leading to higher freight rates.
Despite a strong start and high expectations for a positive impetus carried over from 2013, dry bulk market freight rates faced another challenging year, influenced by surplus capacity and uncertainties in demand that still exist.
Figure: International transport costs for all modes of transport, by regional average
(As percentage of value of imports)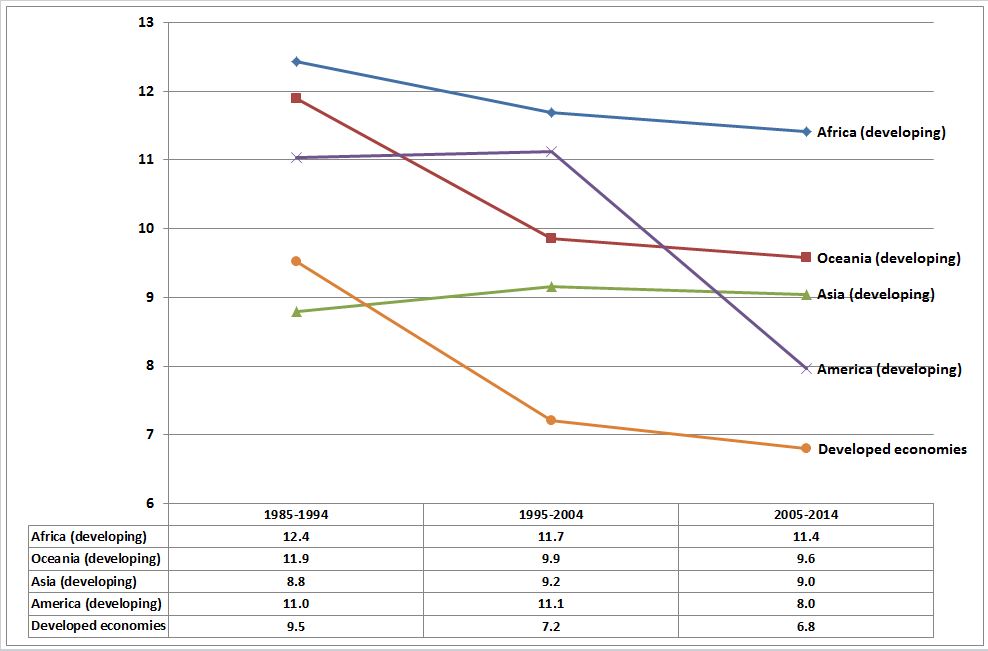
Source: Review of Maritime Transport 2015 (UNCTAD).
Press Release
For use of information media - Not an official record
UNCTAD/PRESS/PR/2015/038
At 11.4 per cent of the value of imports, African countries paid more for international transport than any other region in 2005–2014
Global average was 9 per cent, Review of Maritime Transport 2015 says
Geneva, Switzerland, 14 October 2015
Download Report: Review of Maritime Transport 2015