
The pandemic's impact on digital transformations and how e-commerce and associated digital technologies can contribute to the recovery are in focus during the UNCTAD eCommerce Week 2022 from 25 to 29 April.

© Shutterstock. Goods being delivered to customer during Covid-19 pandemic.
New UNCTAD figures show that the significant uptick in consumer e-commerce activity fuelled by the COVID-19 pandemic was sustained in 2021, with online sales increasing markedly in value, despite the easing of restrictions in many countries.
The average share of internet users who made purchases online increased from 53% before the pandemic (2019) to 60% following the onset of the pandemic (2020/21), across 66 countries with statistics available.
But the situation prior to the pandemic and the extent of the boost to online shopping experienced vary between countries. Many developed countries already had relatively high levels of online shopping (above 50% of internet users) before the pandemic while most developing countries had a lower uptake of consumer e-commerce (Figure 1).
Figure 1. Online shopping before and during the COVID-19 pandemic
Percentage of Internet users who made purchases online, 2019 (x-axis) and 2020/21 (y-axis)
Notes: For most European/OECD countries, data relate to individuals aged 16-74 years who used the internet/shopped online in the 12 months prior to survey. For other countries, wider age ranges and different recall periods may apply. 2021 figures used when available (y-axis) but for a significant minority of countries (29 of 66 countries presented), and especially for developing countries (17 of 19 countries), the latest data relate to 2020.
Greatest rises in developing countries
The greatest rises occurred in several developing countries. In the United Arab Emirates, the share of internet users who shopped online more than doubled, from 27% in 2019 to 63% in 2020. In Bahrain the share tripled, reaching 45% in 2020, and in Uzbekistan it rose from 4% in 2018 to 11% in 2020.
In Thailand, which already had a relatively high uptake prior to the pandemic, a 16-percentage-point increase meant that for the first time more than half of internet users (56%) shopped online in 2020.
Among developed countries, the greatest increases were seen in Greece (up 18 percentage points), Ireland, Hungary and Romania (each 15 percentage points).
Of the 66 countries covered, online shopping remains the lowest in El Salvador (1% of internet users), Azerbaijan (5%), Uzbekistan (11%) and Colombia (17%).
One reason for such differences is that countries differ greatly in their extent of digitalization and therefore in their ability to turn swiftly to digital technologies to mitigate economic disruption. Least developed countries (LDCs) are especially in need of support to take up e-commerce but are not represented in this analysis due to a lack of data on internet usage.
Online retail sales particularly boosted by the pandemic
Official statistics, available for seven countries that together comprise around half of global GDP (including the United States and China), indicate that online retail sales increased substantially in these countries from around $2 trillion in 2019, immediately prior to the pandemic, to around $2.5 trillion in 2020 (not shown) and $2.9 trillion in 2021 [Figure 2, panel a]. China accounts for over half of the online retail sales across these countries and the United States for a further 30%.
The pre-existing upward trend accelerated in many of these countries [panel b]; especially those where a relatively low share of retail sales take place online. In Singapore, online retail sales in 2021 were approaching triple the 2018 level. Canada and Australia also experienced especially large increases over the same period.
Looking across all these countries, although the disruption and economic uncertainty wrought by the pandemic suppressed overall retail sales into 2020 (only Australia and the United States saw retail sales increase from 2019 to 2020), online retail sales grew strongly as people took to shopping online and as offline sales declined [panel c].
This led to a marked increase in the share of online sales in total retail sales - from 16% in 2019 to 19% in 2020 [panel d]. That level was sustained into 2021 despite offline sales picking up strongly. Online sales comprise a much greater share of total retail sales in China (around a quarter in 2021) than in the United States (around one eighth). As a result of steep increases following the onset of the pandemic, the United Kingdom joined Korea (Rep.) in having the highest overall online retail share in 2021, at 28%.
Figure 2. Online retail sales, seven countries, 2018-2021
Value (US$ billions, current prices), Indices (2018=100) and percentage of retail sales
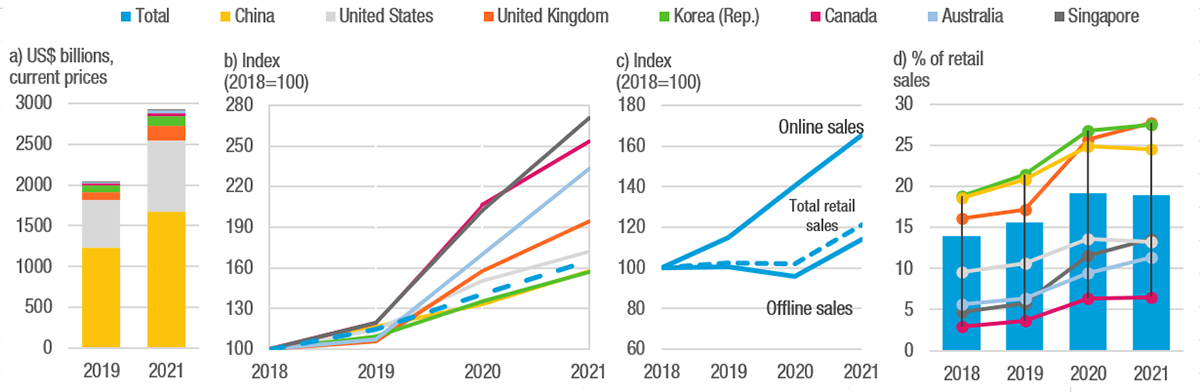
Notes: There may be some differences in the coverage of retail trade statistics across countries. Indexes calculated based on US$ values in current prices.
The biggest online platforms benefit the most
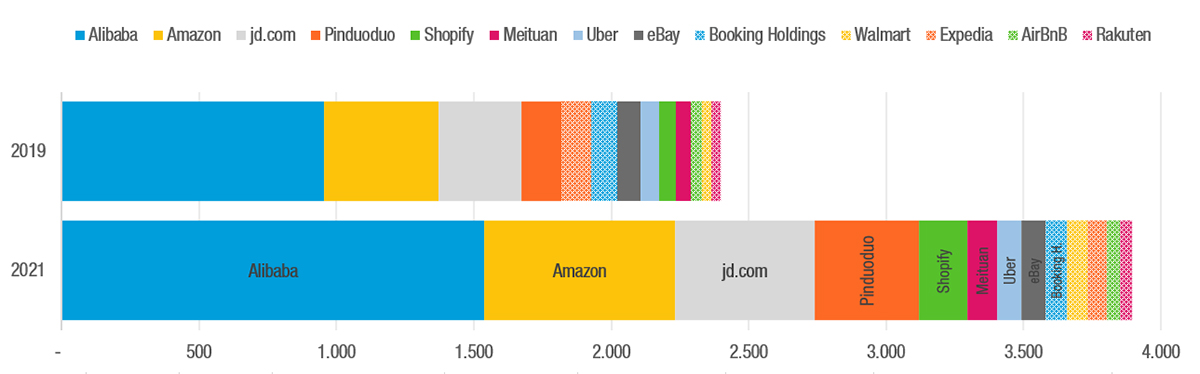
The 13 top consumer-focused e-commerce businesses increased their revenues sharply during the pandemic [Figure 3].
In 2019, these companies made sales worth $2.4 trillion. Following the onset of the COVID-19 pandemic in 2020, this rose sharply to $2.9 trillion (not shown), and a further one-third increase followed in 2021, taking total sales to $3.9 trillion (in current prices).
The shift towards online shopping has further entrenched the already strong market concentration of online retail and marketplace businesses.
Alibaba, Amazon, JD.com and Pinduoduo increased their revenues by 70% between 2019 and 2021 and their share of total sales through all these 13 platforms rose from around 75% in 2018 and 2019 to over 80% in 2020 and 2021.
Expedia, Booking Holdings and AirBnB saw gross bookings decline by up to two thirds in 2020 as movement controls reduced demand for travel and accommodation services, though growth returned in 2021 as restrictions were eased.
Figure 3. Sales by major consumer-focused e-commerce businesses before and during the pandemic
$ billions, current prices
Better statistics are needed
These statistics only provide a partial perspective on the evolution of e-commerce during the pandemic.
There is a pressing need for more inclusive statistics on online retail sales, business-to-consumer and business-to-business e-commerce and cross-border digital trade that can provide insights covering a wider range of countries, especially developing nations.
UNCTAD and its partners are collaborating on establishing the foundations for international statistics that can bring about a better understanding of the links between e-commerce, trade and development and compiling the second edition of the Handbook on Measuring Digital Trade.