
| EMBARGO The contents of this press release and the related Report must not be quoted or summarized in the print, broadcast or electronic media before 16 October 2006, 17:00 GMT (1 PM New York, 19:00 Geneva, 22:30 Delhi, 02:00 - 17 October Tokyo) |
While the "triad" -- the European Union, Japan, and the United States -- is still home to most of the world´s dominant transnational corporations (TNCs), global and regional players are emerging in increasing numbers from developing and transition economies, reveals World Investment Report 2006, FDI from Developing and Transition Economies: Implications for Development (1). The report includes lists of the world´s top 100 TNCs and the top 100 TNCs from developing economies, both ranked by foreign assets. Tables 1 and 2 show the top 25 from each list.
Although developed-country TNCs account for the bulk of global foreign direct investment (FDI), there is a growing and significant presence of FDI by firms -- both private and State-owned -- from developing and transition economies, the report notes. Data on cross-border mergers and acquisitions (M&As), "Greenfield" investments and expansion projects, as well as statistics related to the number of parent companies based outside the developed world, confirm this. The outward expansion of these firms provides development opportunities for their home economies.
The motor vehicle industry dominates the list of the world´s largest TNCs (ranked by foreign assets), followed by pharmaceuticals and telecommunications. By comparison, the largest TNCs from developing economies operate largely in the electrical/electronic equipment and computer industries.
Following a slowdown in their expansion in the early years of the new century, coupled with reduced corporate profits, the transnational activities of the largest TNCs from both developed and developing economies increased significantly in 2003 and 2004. Five companies from developing economies (three of them State-owned) are among the 100 largest in the world. However, there still remains a large gap between the two groups in terms of transnationality (TNI), an index developed by UNCTAD to evaluate the range and degree of foreign activity by TNCs. By way of illustration, the total foreign assets of the top 100 TNCs from developing economies in 2004 amounted to less than the foreign assets of U.S.-based General Electric.
Another aspect of transnationality, the geographic spread of TNC operations, shows that companies from developing countries have, on average, affiliates in six countries, mostly in their own region. By way of contrast, on average the largest TNCs have affiliates in 40 foreign countries, spread across a number of regions.
| The World Investment Report and its database are available online at http://www.unctad.org/wir and http://www.unctad.org/fdistatistics |
ANNEX
Tables
Table 1. The world´s top 25 non-financial TNCs, ranked by foreign assets, 2004 (Millions of dollars and number of employees)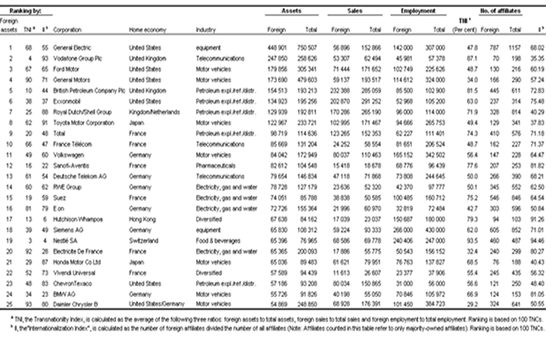
Source: UNCTAD, World Investment Report 2006
Table 2. The top 25 non-financial TNCs from developing countries, ranked by foreign assets, 2004 (Millions of dollars and number of employees)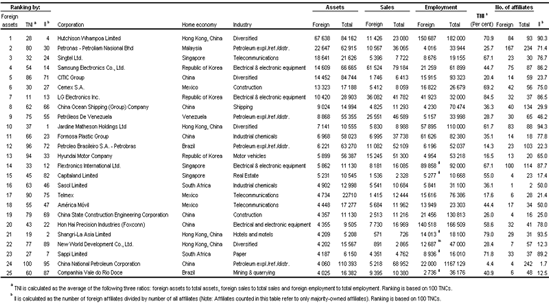
Source: UNCTAD, World Investment Report 2006