Foreign direct investment (FDI) flows to the 83 structurally weak, vulnerable and small economies (SWEs) will be particularly exposed to the negative effects of the coronavirus pandemic, accentuating the marginalization of these countries in global flows, according to UNCTAD’s World Investment Report 2020.
The inflows of the least developed countries (LDCs),[1] the landlocked developing countries (LLDCs)[2] and the small island developing States (SIDS)[3] combined[4] accounted for only 2.5% of the world total. Now that share is expected to erode further.
“The pandemic amplifies the structural weaknesses of these economies, leading to projections of a major decline in FDI in 2020 and 2021,” said UNCTAD’s director of investment and enterprise, James Zhan. “All indicators of resilience are low and all indicators of vulnerability are high in this group of countries, despite all the heterogeneity of size, relative level of development and geographical location,” he cautioned.
Without a push by the international community, these countries will remain on the margins of the structural changes of the global economy and global FDI.
Least developed countries will be hit hard
The pandemic and its economic consequences will hit the 47 LDCs hard. Necessary health measures to control COVID-19 hinder the implementation of ongoing and announced investment projects.
This could affect the many LDCs that are highly dependent on foreign investors both for export-oriented industrial activity and for public-private partnership projects in infrastructure development.
LDCs are highly dependent on investment in natural resources, which is negatively affected by the oil and commodity price shocks. Tourism-dependent LDCs will also see a fall of FDI in this industry.
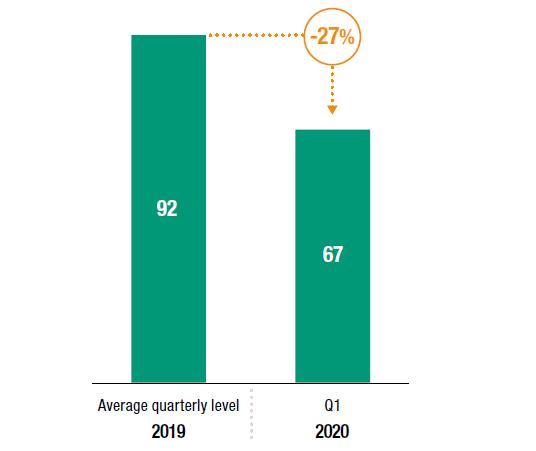
As the crisis deepened in the first quarter of 2020, the decline in announced greenfield FDI in LDCs accelerated. They were down 27% in number (figure 1) and almost 20% in value from the quarterly average of 2019.
Levels in 2019 were already 12% below those of 2018, due largely to a slump in power generation and in mining and quarrying projects. The decline in FDI will add to the economic problems of LDCs and could undo much of the modest progress made during the decade of the Istanbul Programme of Action (2011–2020).
Figure 1 – Average quarterly number announced greenfield investment projects, 2019 and Q1 2020 (Number)
Source: UNCTAD, World Investment Report 2020.
The drop of 2020 will add to the decline of 2019 (-6% to $21 billion), representing 1.4% of global FDI. FDI flows to Asian LDCs shrank for the first time in eight years by 27% to $8.6 billion, while those to African LDCs increased by 17% to a three-year high of $12 billion. Many of larger host economies saw a major decline in their FDI.
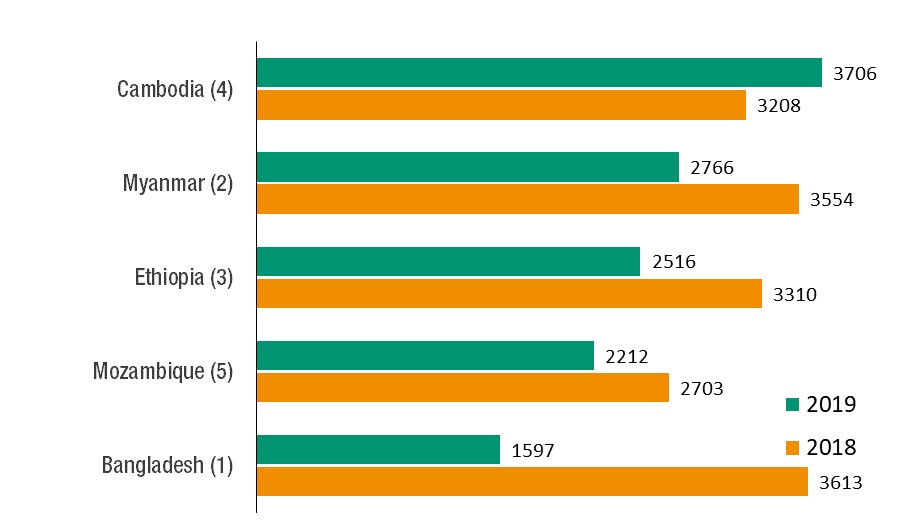
The share of FDI in the top five recipients (Cambodia, Myanmar, Ethiopia, Mozambique and Bangladesh) dropped from nearly 75% in 2018 to about 60% of total FDI to the group in 2019 (figure 2).
Figure 2: Top 5 recipients of FDI inflows, 2018 and 2019 (Millions of dollars)
Source: World Investment Report 2020.
Landlocked developing countries struggling economically
All 32 LLDCs are struggling with the economic impact of the pandemic on FDI inflows. With the closing of borders, transportation links with the global economy have been seriously disrupted.
Border closures affect LLDC trade and investment links disproportionately, as they cannot turn to direct sea transport, the mode that carries an estimated 80% of global trade.
Border closure measures also hinder regional integration efforts, which have been an important factor mitigating the disadvantage of being landlocked, and disrupt trade corridors, land transport and connectivity efforts.
During the lockdown it has become problematic to send experts to remote mining areas in LLDCs, such as the You Tolgoi mine in Mongolia.
In several LLDCs, the impact of the lockdown on global value chains is causing a decline in export-oriented operations. Disruptions in manufacturing activities along supply chains are hindering the sourcing of equipment and machinery. This affects many LLDCs, which are dependent on imported equipment that must cross various land borders.
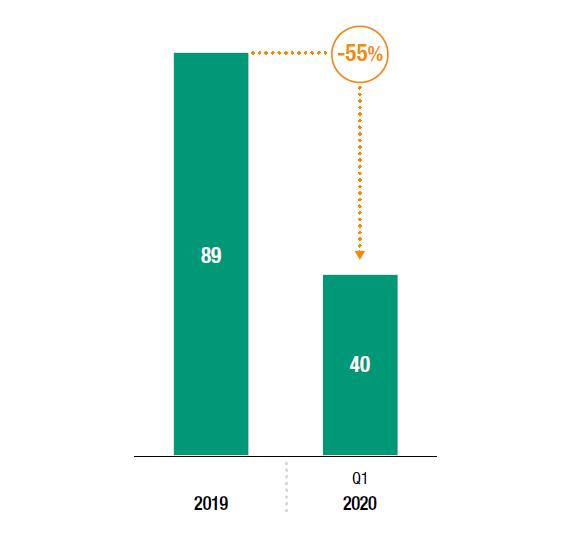
The severity of the potential decline in inward FDI is evidenced by the fall in the number of announced greenfield projects, one of the key indicators of investors’ intentions. In the first quarter of 2020, there were only 40 projects, a decline of 55% from the quarterly average of 2019 (figure 3).
Figure 3 – Average quarterly number of announced greenfield investment projects, 2019 and Q1 2020 (Number)
Source: World Investment Report 2020.
These negative developments will compound the effects of two years of decline in inbound FDI, which in 2019 declined by 1% to $22 billion – or 1.4% of global FDI inflows.
Investment into transition-economy LLDCs proved resilient to stagnation. FDI to African LLDCs declined moderately, while Asian and Latin American LLDCs experienced a more pronounced downturn.
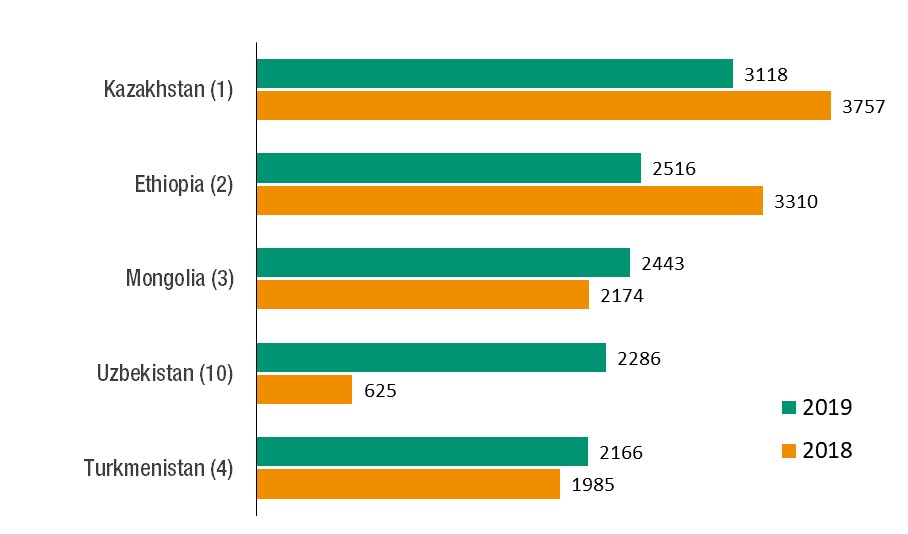
Flows to LLDCs remained concentrated in a few economies, with the top five recipients (Kazakhstan, Ethiopia, Mongolia, Uzbekistan and Turkmenistan) accounting for 57% of total FDI to the group (figure 4).
Figure 4 – Top 5 recipients of FDI inflows, 2018 and 2019 (Millions of dollars)
Source: World Investment Report 2020.
Small islands developing States disproportionately affected
The global health and economic crisis will affect FDI prospects for the 28 structurally disadvantaged SIDS disproportionately. Measures restricting the movement of people put in place in many parts of world to control the spread of the pandemic are taking a severe toll on these already fragile economies.
Tourism-dependent SIDS will be hit the hardest. Announced greenfield FDI data for 2015–2019 suggest that travel, tourism and hospitality projects contributed to more than half of the total of new investment announced in SIDS.
The importance of these projects is also significant for a relatively less-tourism-dependent economy, like Jamaica, where tourism-related projects accounted for 54% of the total value of announced greenfield FDI projects in the last five years.
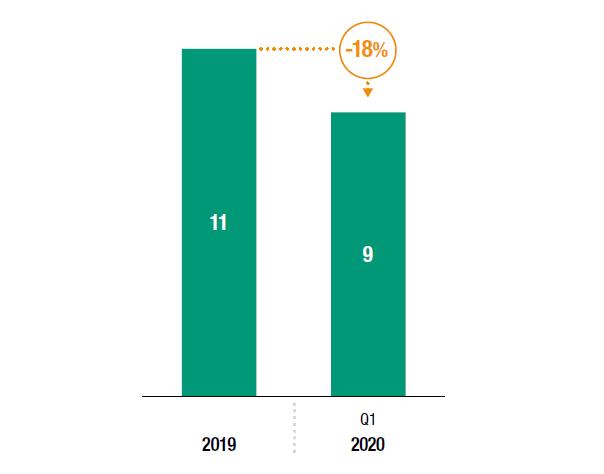
Figure 5: Average quarterly number of announced greenfield investment projects, 2019 and Q1 2020 (Number)
Source: UNCTAD, World Investment Report 2020.
The first quarter of 2020 showed signs of a contraction in FDI flows: 18% in the number (figure 5) and 28% in value of announced projects below the average quarterly value in 2019.
Given the gravity of downward earnings’ revisions by global multinational enterprises (MNEs) across industries for the fiscal year 2020, FDI will fall not only in tourism-related projects but also in industries, such as electricity generation, finance and ICT, in which certain SIDS depend on foreign capital.
Compounding the downward pressure on FDI inflows is the high dependency of SIDS on FDI by major investors from Europe and North America, which were severely affected by the pandemic.
In 2019, FDI flows to SIDS increased by 14% to $4.1 billion after two years of decline, representing 0.3% of global FDI.
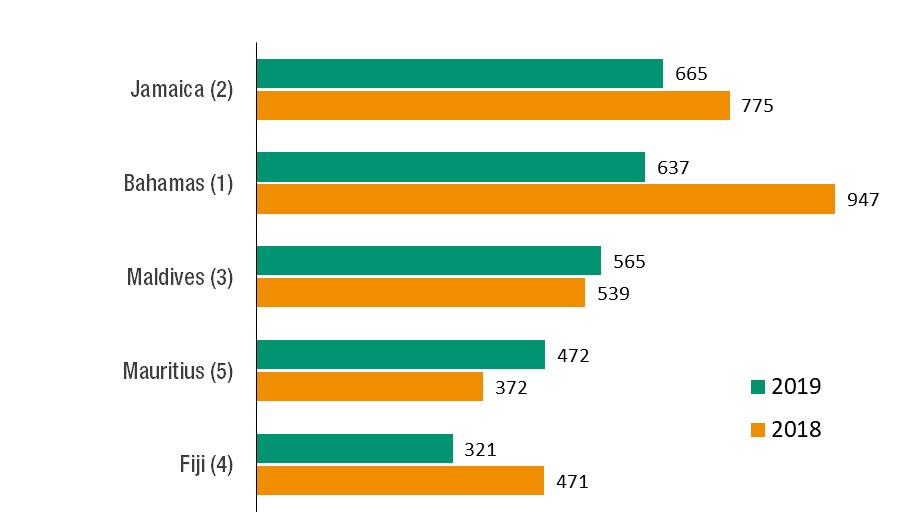
The top five FDI recipients (Jamaica, the Bahamas, the Maldives, Mauritius and Fiji) attracted nearly two-thirds of all FDI to this group, but only two (the Maldives and Mauritius) registered higher flows than in 2018 (figure 6).
Figure 6 – Top 5 recipients of FDI inflows, 2018 and 2019 (Millions of dollars)
Source: UNCTAD, World Investment Report 2020.
[1] Afghanistan, Angola, Bangladesh, Benin, Bhutan, Burkina Faso, Burundi, Cambodia, the Central African Republic, Chad, the Comoros, the Democratic Republic of the Congo, Djibouti, Eritrea, Ethiopia, the Gambia, Guinea, Guinea-Bissau, Haiti, Kiribati, the Lao People’s Democratic Republic, Lesotho, Liberia, Madagascar, Malawi, Mali, Mauritania, Mozambique, Myanmar, Nepal, the Niger, Rwanda, Sao Tome and Principe, Senegal, Sierra Leone, Solomon Islands, Somalia, South Sudan, the Sudan, Timor-Leste, Togo, Tuvalu, Uganda, the United Republic of Tanzania, Vanuatu, Yemen and Zambia.
[2] Afghanistan, Armenia, Azerbaijan, Bhutan, the Plurinational State of Bolivia, Botswana, Burkina Faso, Burundi, the Central African Republic, Chad, Eswatini, Ethiopia, Kazakhstan, Kyrgyzstan, the Lao People’s Democratic Republic, Lesotho, Malawi, Mali, the Republic of Moldova, Mongolia, Nepal, the Niger, North Macedonia, Paraguay, Rwanda, South Sudan, Tajikistan, Turkmenistan, Uganda, Uzbekistan, Zambia and Zimbabwe.
[3] Antigua and Barbuda, the Bahamas, Barbados, Cabo Verde, the Comoros, Dominica, Fiji, Grenada, Jamaica, Kiribati, Maldives, the Marshall Islands, Mauritius, the Federated States of Micronesia, Nauru, Palau, Saint Kitts and Nevis, Saint Lucia, Saint Vincent and the Grenadines, Samoa, Sao Tome and Príncipe, Seychelles, Solomon Islands, Timor-Leste, Tonga, Trinidad and Tobago, Tuvalu and Vanuatu.
[4] The category of LDCs overlaps partly with that of LLDCs and SIDS. There are 17 economies that are both LDCs and LLDCs and 7 that are both LDCs and SIDS.


