Skip to main content
MACHINE NAME = WEB 1
English
Français
Español
Toggle Languages
English
Français
Español
Browse
New Branding Header
Our brand
Global crisis
SDG costing
Our brand
Global crisis
SDG costing
Toggle navigation
Main navigation
About
We help developing countries benefit from the global economy more fairly and effectively, providing data and analysis, facilitating consensus-building and offering technical assistance on issues related to trade and development.
Secretary-General
Rebeca Grynspan
Deputy Secretary-General
Pedro Manuel Moreno
UNCTAD15 outcome documents
Annual Report 2023
UNCTAD at a Glance
Brand Hub
Delegates Portal
(password required)
Accountability
History
Member States
Organigramme
Partnerships
Topics of work
Trade and Development Board
Topics
We help countries achieve inclusive, sustainable growth by transforming the ambitions of the Sustainable Development Goals into actions that deliver concrete results. Our work focuses on:
Africa
Commodities
Competition and consumer protection
Debt and development finance
E-commerce and the digital economy
Enterprise development
Gender equality
Investment
Landlocked developing countries
Least developed countries
Macroeconomics
The Palestinian people
Science, technology and innovation
Small island developing states
South-South cooperation
Trade agreements
Trade analysis
Trade and environment
Training and capacity building
Transport, logistics and trade facilitation
Youth
Statistics and data
We provide reliable and timely data and statistics to help countries better understand trade and development trends and design more effective economic, environmental and social policies.
Featured
Data stories
Data hub
UNCTADstat Data centre
Data insights
Nowcasts
Country profiles
In focus
Costs of achieving the SDGs
Pulse of the global cost-of-living crisis
Productive Capacities Index
SDG Pulse
World of Debt Dashboard
TRAINS Portal (trade regulations and non-tariff measures)
Publications
Our research and publications provide authoritative and evidence-based analysis on trade and development and policy recommendations to help countries tackle today’s biggest challenges.
Featured
Commodities and Development Report
Digital Economy Report
Economic Development in Africa Report
Handbook of Statistics
Least Developed Countries Report
Review of Maritime Transport
Technology and Innovation Report
Trade and Development Report
World Investment Report
Search for a publication
In focus
Global Investment Trends Monitor
Global Trade Update
Policy briefs
Working Papers
UNCTAD Rapid Assessments
Meetings
Our meetings and events convene governments, businesses, civil society organizations, academia and international organizations to discuss and build consensus on the most pressing trade and development issues.
Featured
5th UN Ocean Forum
14th Debt Management Conference
eWeek
Trade and Development Board
UN Commission on Science and Technology for Development
UNCTAD's 60th anniversary
UNCTAD15
World Investment Forum
Calendar
Search for a meeting
Meeting series in focus
Commissions
Investment, enterprise and development
Trade and development
Expert meetings
Intergovernmental groups of experts
Competition law and policy
Consumer protection law and policy
E-commerce and the digital economy
Financing for development
International standards of accounting and reporting
Technical cooperation
Our technical cooperation helps developing countries better integrate into the global economy by transforming their economies, tackling vulnerabilities, improving competitiveness and empowering people.
Featured programmes
Automated System for Customs Data (ASYCUDA)
Debt Management and Financial Analysis System (DMFAS)
In focus
Impact stories
Map of UN Development Account projects
Project requests
Sources of funding
Technical assistance toolbox
Media
For registered journalists
Newsroom
(password required)
Latest
Brand assets
News
Press releases
Secretary-General statements
The Weekly Tradecast episodes
Videos
Main navigation right
Home
Data Visualization
Data Visualization
Displaying results 1 - 7 of 7
Operator
Contains all of these words
Contains any of these words
Contains none of these words
Search
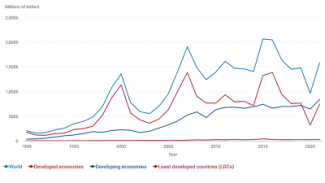
Global foreign direct investment flows over the last 30 years
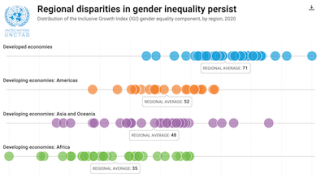
The persisting regional gaps in gender equality
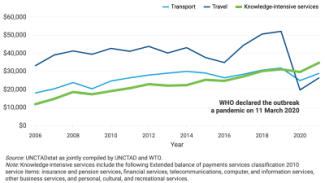
Knowledge-intensive services show resilience and promise in Africa
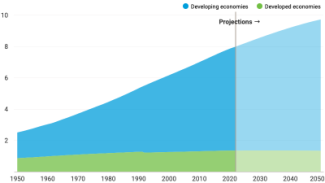
Now 8 billion and counting: Where the world’s population has grown most and why that matters
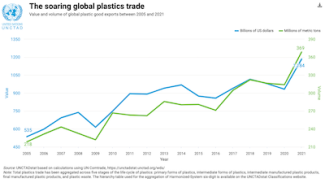
Global plastics trade hits record $1.2 trillion
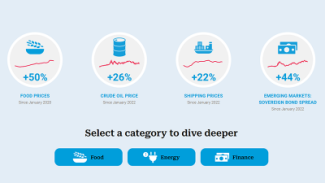
Food, Energy and Finance: The pulse of the global cost-of-living crisis
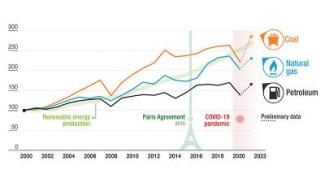
Fossil fuels: Trading in the wrong direction