
Discover the only dashboard that provides clear insights into global, regional and national debt. Easily understand debt dynamics and their impact on economic and financial stability.
© UN Trade and Development (UNCTAD)
Global public debt has nearly doubled since 2010, reaching a historic $97 trillion in 2023. Rising interest rates are further straining government budgets, especially in developing countries.
Today, over 3.3 billion people live in countries that spend more on debt interest payments than on education or healthcare, highlighting the critical need for accurate and timely debt data.
The “A World of Debt Dashboard”, developed by UN Trade and Development (UNCTAD) in collaboration with the United Nations Regional Economic Commissions, offers policymakers, researchers, journalists and the public with easy-to-understand data to help navigate the complexities of global, regional and national debt.
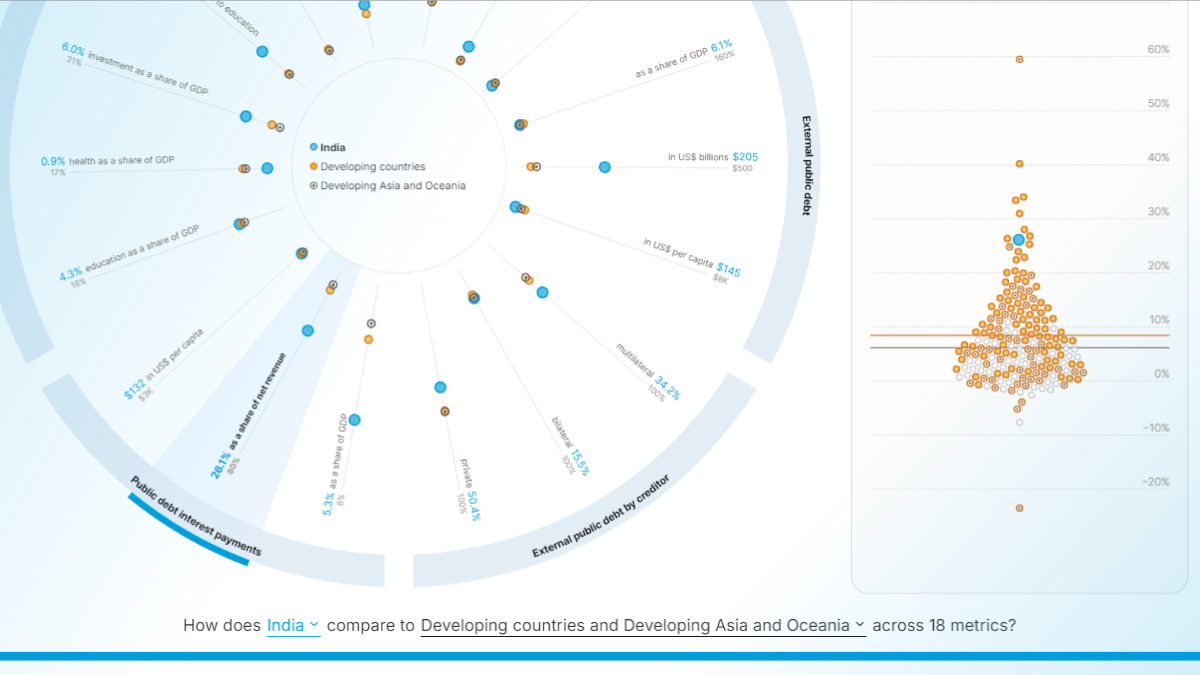
This unique dashboard covers 18 key indicators across 188 countries, allowing users to assess current debt situations, compare them with others worldwide and observe changes over time. Intuitive filters and interactive graphs make it easy to customize searches and explore specific areas of interest.
Get a complete perspective on debt challenges
The dashboard provides a comprehensive view of debt challenges, featuring up-to-date information on 18 key public finance and debt indicators. It allows for easy comparison between countries and across regions, development status, income levels and economic categories.
The regions covered include Africa, the Arab region, Asia and the Pacific, Europe and Central Asia, and Latin America and the Caribbean. Special analysis is also provided for least developed countries and small island developing states, which face unique challenges.
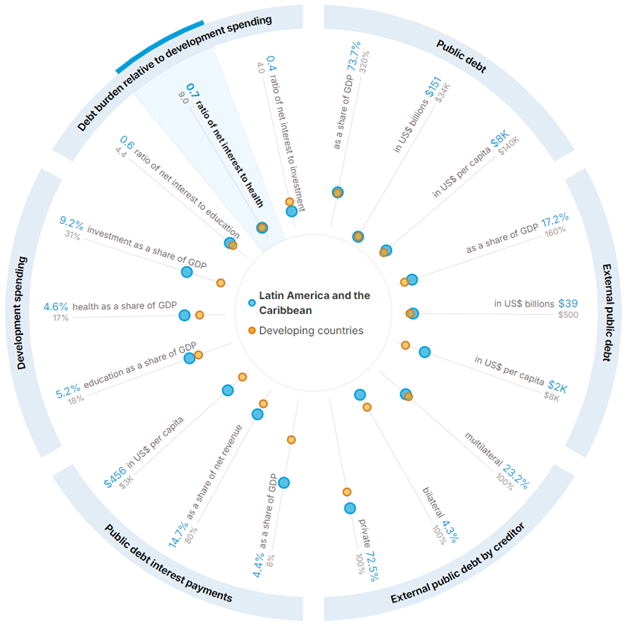
For instance, the latest data for Latin America and the Caribbean shows an average public debt-to-GDP ratio of 73.7%, with countries spending 4.4% of GDP on interest payments. This amount represents 14.7% of government revenues and is nearly equal to the expenditure on education (5.2% of GDP) and healthcare (4.6% of GDP). The dashboard also offers a comparison with figures for other developing countries.
A comprehensive view of debt in Latin America and the Caribbean
Instantly compare your country’s debt situation with others worldwide
The dashboard features user-friendly data visualizations that allow users to compare a country or region with others worldwide, helping to contextualize the challenges faced by a specific group or single country. Users can interact with the visualizations to focus on particular countries, view their latest data and conduct further analysis.
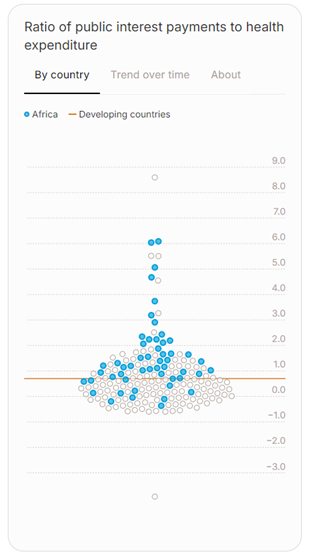
For example, the visualization below shows the global distribution of the ratio of debt interest payments to health spending. A higher ratio indicates that a country spends more on interest than on health.
The dashboard reveals two key insights. First, most African countries allocate more to interest payments than to health, compared to most developing nations. Second, some countries in Africa spend up to six times more on interest than on health, underscoring the significant challenge that debt poses to development on the continent.
Debt interest payments vs. health spending in African countries, compared to other developing nations
Analyze the evolution of debt over time
The dashboard’s comprehensive dataset and interactive features also allow users to compare trends over time.
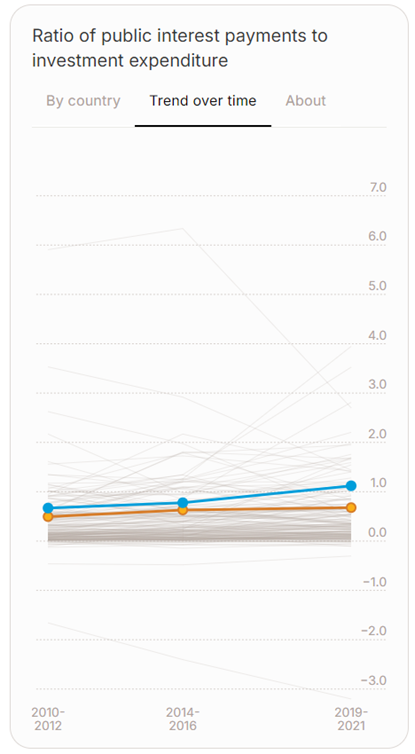
For example, the data visualization below shows the evolution of the ratio of interest payments to investment expenditure for developing countries in Asia and Oceania. A higher number indicates that the region is spending more on interest relative to public investment.
The visualization reveals three key insights. First, countries in the region spend on average more on interest than on investment. Second, this trend has worsened over the last decade. Third, countries in the region allocate more to interest than to public investment compared to the average for all developing countries. These unfavorable dynamics hamper the efforts of countries in the region to mobilize investment towards achieving the Sustainable Development Goals.
Evolution of debt interest payments vs. public investment in Asia and Oceania, compared to other developing nations
Why should you explore the dashboard?
The “A World of Debt Dashboard” is an essential tool for understanding global debt dynamics. It simplifies complex data, enabling users to engage with key issues in meaningful ways.
Whether you are a researcher, policymaker or someone looking to better understand debt and its impact on economies worldwide, the dashboard offers a comprehensive platform to explore these dynamics.