| EMBARGO The contents of this press release and the related Report must not be quoted or summarized in the print, broadcast or electronic media before 17 September 2009,17:00 [GMT] (13:00 New York; 19:00 Geneva, 22:30 New Delhi, 02:00 - 18 September 2009 Tokyo) |
Geneva, 17 September 2009 - As a result of a worsening of the financial and economic crisis in 2008, prospects for global foreign direct investment (FDI) remain gloomy, reports UNCTAD´s annual study of worldwide investment trends.
The World Investment Report 2009(1), released today, estimates that FDI inflows will fall from about US$1.7 trillion in 2008 to below $1.2 trillion in 2009. Recovery is expected to be slow in 2010, reaching no more than $1.4 trillion, but gathering momentum in 2011 to approach $1.8 trillion.
The report, known as the WIR, is subtitled Transnational Corporations, Agricultural Production and Development.
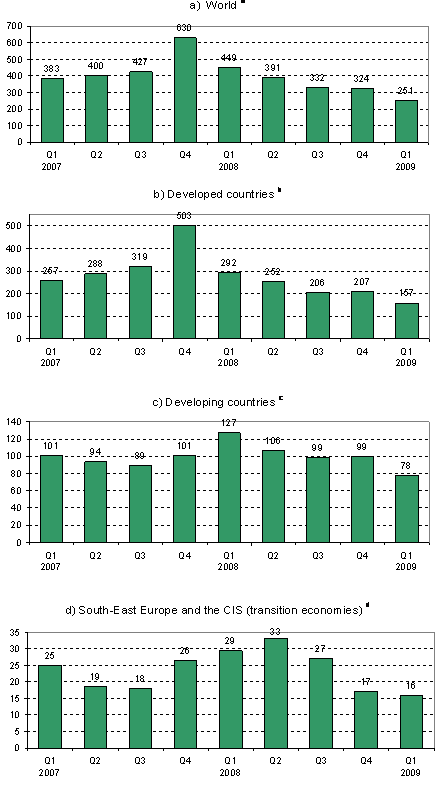
While FDI inflows declined globally and in developed countries, where the financial crisis originated, flows to developing countries and the transition economies of South-East Europe and the Commonwealth of Independent States (CIS) continued to rise last year. This reflected, in part, a delay as the economic downturn worked its way through the economies of developing countries and only more slowly affected their exports This dynamic, along with preliminary data for the first quarter of 2009, explains the downturn in FDI flows in all regions in the second half of 2008 (figure 1).
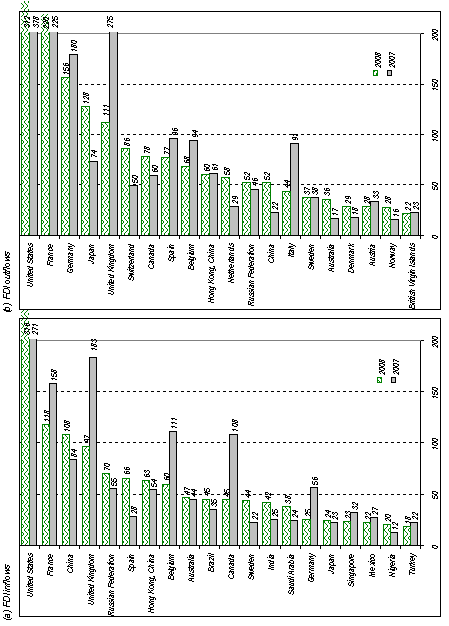
The crisis has changed the FDI landscape, with a surge in the developing and transition economies´ share in global FDI flows to 43% in 2008. This change in the pattern of inflows is partly due to the large decline in FDI inflows to developed countries, which in 2008 shrank by 29%, to $962 billion, compared with their level of the previous year. Even so, the United States remained the world´s largest recipient country, followed by France, China, the United Kingdom, and the Russian Federation. The appearance of China and the Russian Federation among the top five recipients is indicative of the changing FDI landscape. FDI inflows to developing economies rose by 17%, to US$621 billion, with South, East, South-East Asia and Oceania accounting for roughly half of those flows. Africa recorded the largest percentage increase (27%). Inflows to Latin America and the Caribbean continued to grow (up 13%) as did those to West Asia (up 16%). The least developed countries (LDCs) attracted a record US$33 billion worth of inward FDI in 2008. The transition economies of South-East Europe and the CIS also posted a new record high, with inflows reaching $114 billion. But in 2009 FDI flows to all regions will suffer a decline.
FDI outflows from developed countries in 2008 fell less sharply (-17%) than inflows. The United States maintained its position as the largest single source country of FDI, followed by France, while Japan, with a 74% increase in outward FDI, entered the list of top five investing countries. In general, outflows from developing regions continued to grow, reaching US$293 billion in 2008, though the performances of individual regions varied. Transnational corporations (TNCs) in Latin America and East Asia -- especially China -- engaged in significant outward expansion. West Asia, on the other hand, reported a substantial decline in outward FDI. Among developing and transition economies, the three largest sources of FDI were Hong Kong (China), the Russian Federation, and China, which ranked among the top 20 investors in the world (figure 2).
A major contributing factor to the decline in global FDI flows has been growing divestments by TNCs worldwide. Since mid-2008 these divestments, which can take the form of repatriated investments, reverse intra-company loans, or repayments of debt to parent firms, have exceeded gross FDI flows in a number of countries. Illustrative of this trend was that roughly one third of cross-border mergers and acquisitions (M&As) during 2008 and the first half of 2009 involved the sale of foreign affiliates to other companies.
Cross-border M&As - a major source of growth of FDI in previous years - declined considerably as financial markets seized up in the second half of 2008. Taking that year as a whole, the value of such transactions fell by 35% to US$673 billion (a level roughly equal to that of 2006), and so far in 2009 the rate of M&As has continued to fall. Indeed, the year-on-year fall in cross-border M&As in the first quarter of 2009 was 76%. Private equity firms, which through leveraged buyouts fuelled the earlier rise in M&As, saw the value of their cross-border transactions drop 38% in 2008, with a sharper decline registered in the first half of 2009. Bucking the general trend, however, sovereign wealth funds (SWFs) recorded a rise in FDI in 2008. The value of their cross-border M&As - the predominant form of FDI by SWFs - shot up by 16% to $20 billion. These funds too, however, were increasingly impacted by the financial and economic crisis as the value of their previous investments plummeted.
In the current environment of financial turmoil and massive government intervention in economies, 2008 and early 2009 were notable for the absence of a general trend in public policies towards greater investment protectionism. UNCTAD´s annual Survey of Changes to National Laws and Regulations Related to FDI indicated that during 2008, 110 new FDI-related measures were introduced, of which 85 were more favourable to FDI. Compared to 2007, the percentage of less-favourable measures for FDI remained unchanged (table 1).
In the aftermath of the crisis, and once the global economy is on its way to recovery, the exit of government funds from ailing industries could provide the catalyst for a new wave of cross-border M&As, the report notes. TNCs in industries that are less sensitive to the business cycle and which experience fairly constant demand (such as agribusiness and some services), as well as those with positive long-term growth prospects (such as pharmaceuticals), have the brightest FDI prospects and are thus likely to drive the next FDI boom, the report says.
The World Investment Report and its database are available online at http://www.unctad.org/wir and http://www.unctad.org/fdistatistics |
ANNEX
Tables and figures
Figure 1. FDI inflows, 2007-2009, by quarter
Source:UNCTAD, World Investment Report 2009: Transnational Corporations, Agricultural Production and Development, figure I.12
Note:a Total for 96 countries accounting for 91 % of world inflows in 2007-2008
b Total for 35 countries accounting for almost all of developed countries inflows in 2007-2008
c Total for 49 countries accounting for 74 % of developing countries inflows in 2007-2008
d Total for 12 countries accounting for 95 % of South-East Europe and the CIS (Transition economies) inflows in 2007-2008
Figure 2. Global FDI flows, top 20 economies, 2007-2008
Source:UNCTAD, World Investment Report 2009: Transnational Corporations, Agricultural Production and Development, annex table B.1 and FDI/TNC database (www.unctad.org/fdistatistics)
Note:a Ranked on the basis of the magnitude of 2008 FDI inflows
Table 1. National regulatory changes, 1992-2008
Source: UNCTAD, World Investment Report 2009: Transnational Corporations, Agricultural Production and Development, Table I.14


